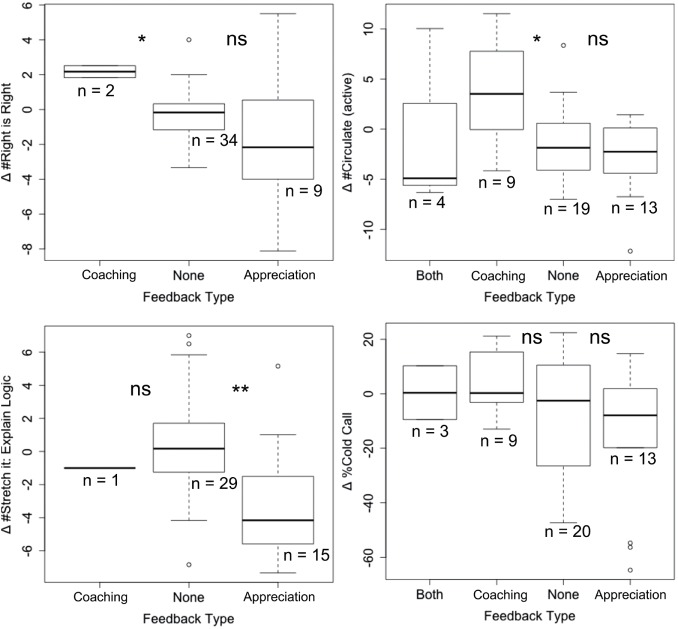
FIGURE 3.
Changes in GTA classroom practices following feedback. Changes in technique frequency between prefeedback and postfeedback observation sessions. Box sections represent second and third quartiles. Whiskers represent first and fourth quartiles. Thick line represents median. Outliers are shown with open circles. Coaching, feedback intended to bring practice closer to defined task standard; appreciation, feedback that recognizes performance in line with task standard. n = number of instances where particular type of feedback was given. *, p value <0.05; **, p value <0.01; ns, p value >0.05. See the text for p values.

