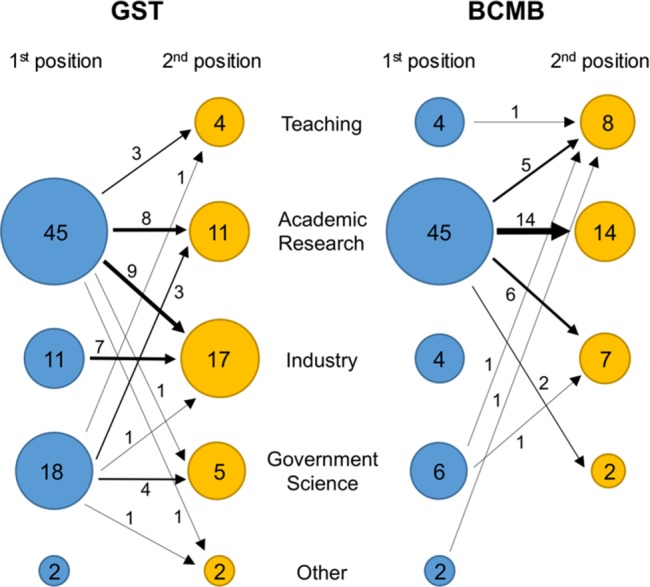
FIGURE 2.

Career transitions for alumni from the GST program (left) and BCMB (right). For each program, the left column shows the sector of the graduate's first position after PhD and the right column shows a subsequent position, usually the second position. The numbers reflect numbers of individuals, not percentages; note that about half of the alumni have not yet moved into a second position. Transitions from one sector to another are depicted by arrows; the flux is indicated by the number of individuals and line thickness.
