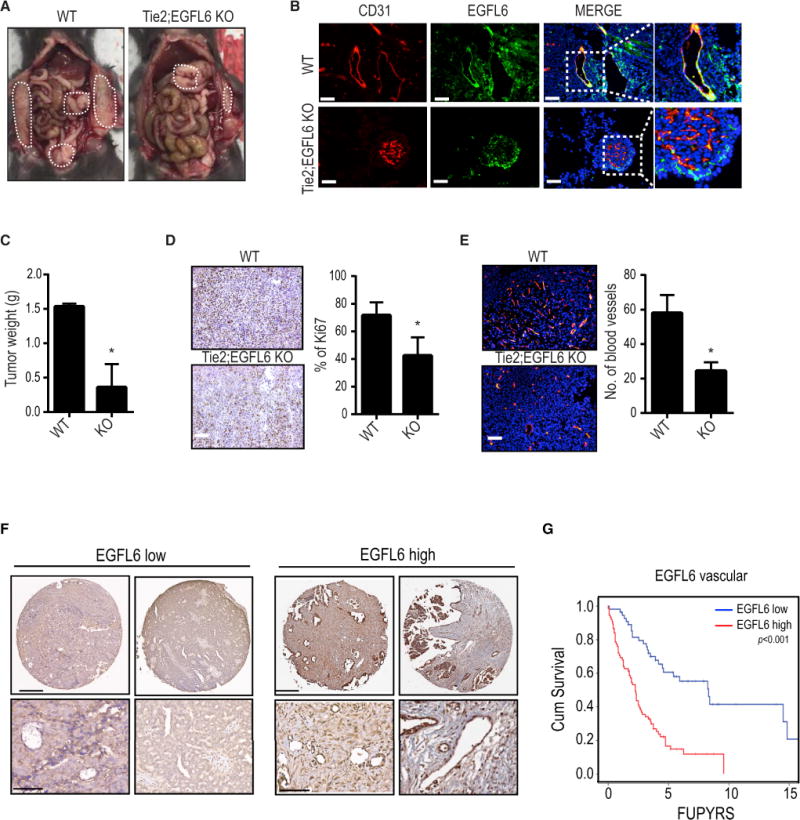
Figure 6. Effect of endothelial-specific EGFL6 knock-out on tumor growth and angiogenesis.

a, Tumor growth in Tie2;EGFL6 KO mice (KO) and WT mice. ID8 murine ovarian cancer cells were injected into KO and WT mice (n=10 mice per group). b, Double immunofluorescence staining of CD31 and EGFL6 in ID8 tumor from WT and KO mice. Scale bar = 100 µm. c, Bar graph represents tumor weight. d and e, Proliferation (Ki67) and microvessel density (CD31) counted in WT and KO mice tumor sections. Error bars indicate SEM. Scale bar = 100 µm. *p<0.05 vs. WT mice. f, Representative images of human ovarian cancer vasculature with low or high immunohistochemical staining for EGFL6. Scale bar =200 µm. Representative images were taken from different samples. g, Kaplan-Meier curves of disease-specific mortality of patients whose ovarian vasculature expressed low versus high EGFL6. See also Figure S6 and Table S1.
