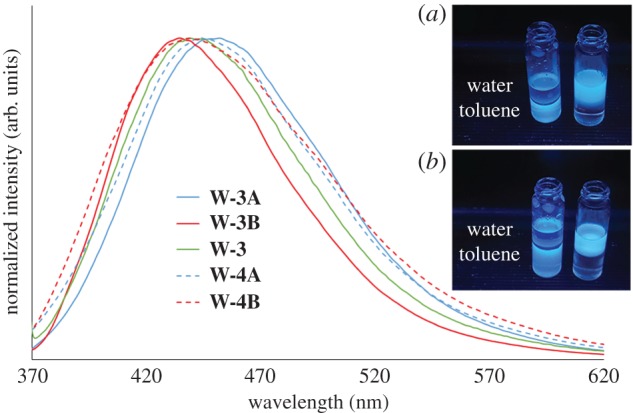
Figure 4.

Emission spectra (excitation at 360 nm, concentration 0.2 g l−1 in deionized water for the W-3 series and concentration 0.2 g l−1 in toluene for the W-4 series) of W-3A (solid blue line), W-3B (solid red line), W-3 (solid green line), W-4A (dashed blue line) and W-4B (dashed red line). In the inset are shown pictures of the following samples, under excitation at 366 nm: (a) W-4A dispersed in toluene (left) and W-3A dispersed in water (right); (b) W-4B dispersed in toluene (left) and W-3B dispersed in water (right).
