
Figure 3.
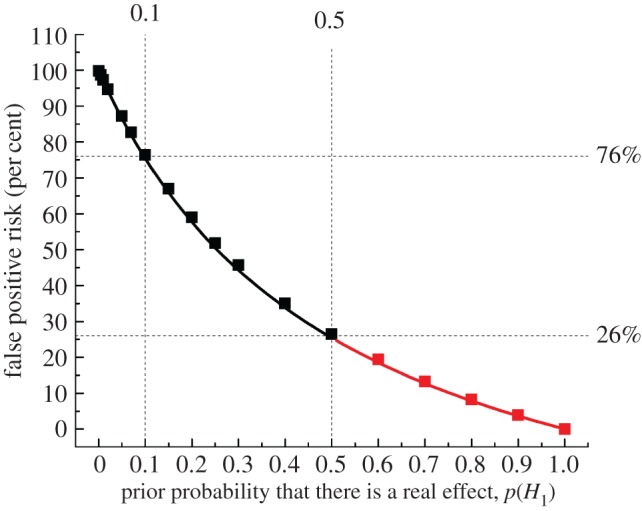
The false positive risk plotted against the prior probability for a test that comes out with a p-value just below 0.05. The points for prior probabilities greater than 0.5 are red because it is essentially never legitimate to assume a prior bigger than 0.5. The calculations are done with a sample size of 16, giving power = 0.78 for p = 0.0475. The square symbols were found by simulation of 100 000 tests and looking only at tests that give p-values between 0.045 and 0.05. The fraction of these tests for which the null hypothesis is true is the false positive risk. The continuous line is the theoretical calculation of the same thing: the numbers were calculated with origin-graph.R and transferred to origin to make the plot.