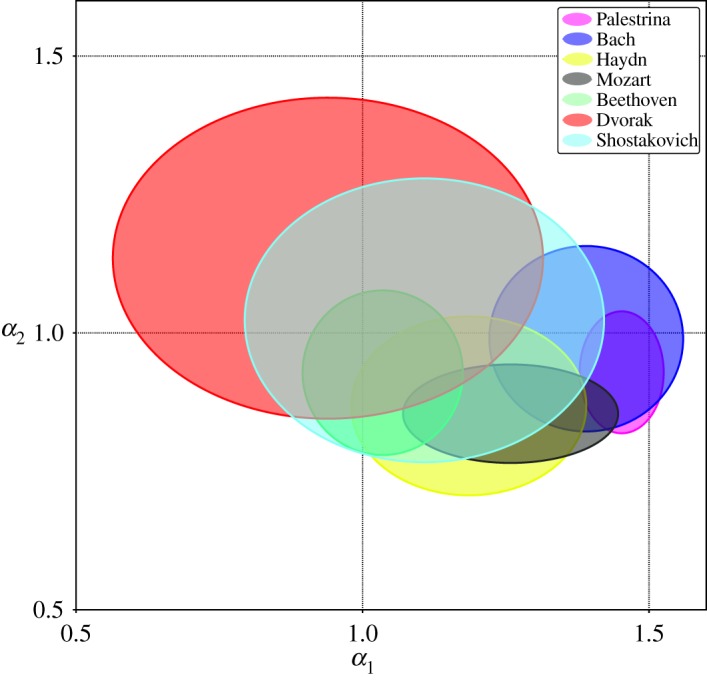
Figure 10.

α2 versus α1 plot for the 162 pieces that exhibit a crossover in their fluctuations function. Each of the ellipses represents a composer. They are centred at the mean values of their α1 and α2 exponents. The axes are fixed by the respective standard deviation of Hurst exponents.
