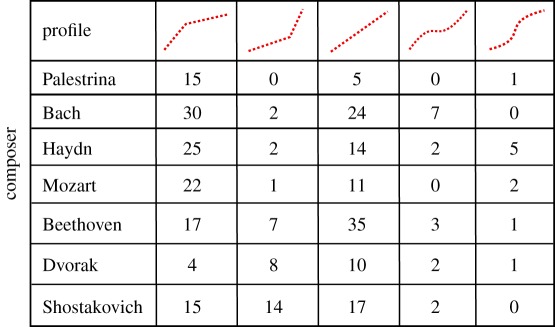
Table 2.
Classification by fluctuation profiles of the pieces analysed in this study. The first row shows the five different profiles we could identify. Numbers indicate the amount of scores of each composer with a given profile. The classification has been done by careful eye inspection of the scaling plots.
 |
