
Figure 2.
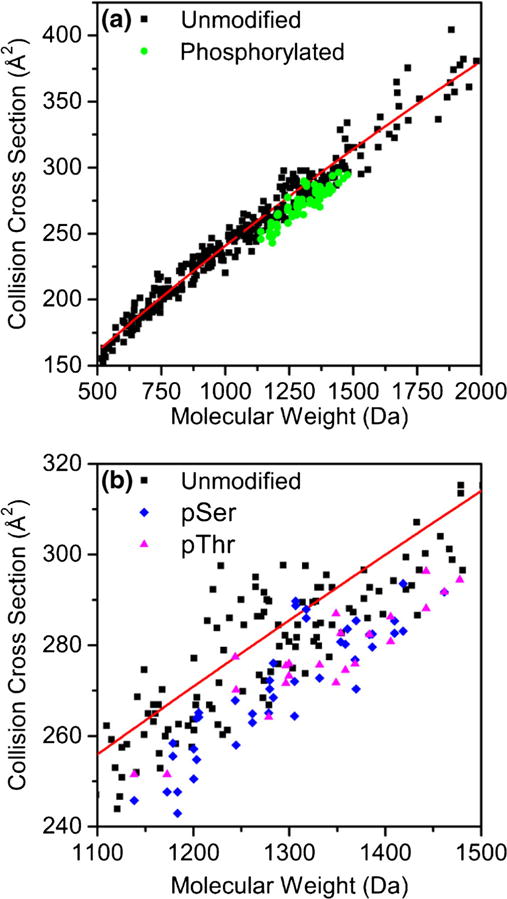
Collision cross sections for phosphorylated (green circles) and unmodified (black squares) peptide [M + 2H]2+ ions as a function of molecular mass are shown in (a). The red line is a second-order polynomial fit (Ω = −1.334E−5x2 + 0.1798x + 74.2775) to the 284 previously measured cross section values from tryptic peptides as explained in the text. The region of the cross section versus molecular mass plot where the pSer (blue diamonds) and pThr (magenta triangles) peptides are found is shown in (b)