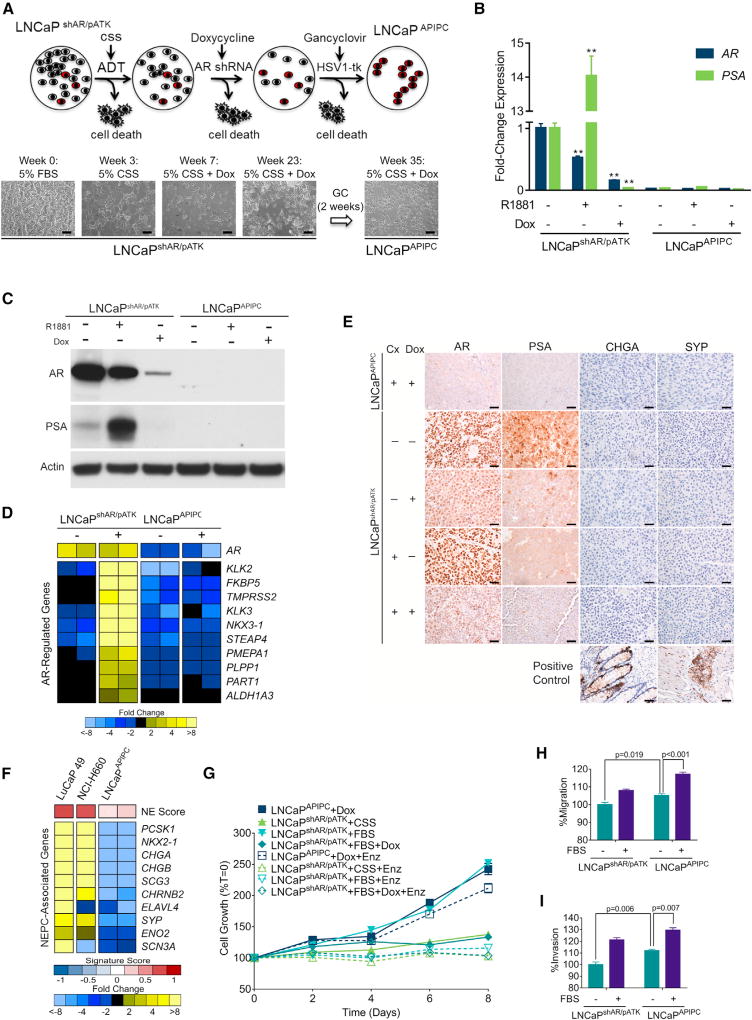
Figure 2. Characterization of a Model of AR Program-Independent Prostate Cancer.
(A) LNCaP cells with a doxycycline (Dox)-inducible shRNA targeting the AR (shAR) and an androgen-driven thymidine kinase gene (pATK) were starved of androgens (ADT) and treated with Dox to induce the AR-directed shRNA, then treated with ganciclovir to eliminate cells with AR-driven thymidine kinase expression. Scale bars, 10 µm.
(B) qRT-PCR analysis of AR and PSA expression in LNCaPshAR/pATK and LNCaPAPIPC with 1 nM R1881 or 1 µg/mL Dox treatment. Significance was determined by Student’s t test and data are presented as mean ± SEM (n = 4 replicates per data point); **p < 0.01.
(C) AR and PSA immunoblots of cell lysates from LNCaPshAR/pATK and LNCaPAPIPC cultured in androgen-deprived conditions and treated with or without R1881 and with or without Dox.
(D) Quantitation of AR-regulated transcripts following treatment with the synthetic androgen R1881 (+) in parental LNCaPshAR/pATK and LNCaPAPIPC cells. Measurements were made by RNA sequencing (n = 2 biological replicates per group).
(E) Immunohistochemical analysis of AR, PSA, CHGA, and SYP in parental LNCaPshAR/pATK and LNCaPAPIPC xenografts. Cx, castration; Dox, doxycycline. Scale bars, 10 µm.
(F) Expression of neuroendocrine-associated transcripts in the NEPC LuCaP49 PDX model, NEPC NCI-H660 cell line, and LNCaPAPIPC cells. Measurements were made by RNA sequencing (RNA-seq) (n = 2 biological replicates of LNCaPAPIPC cells, 1 each of LuCaP49 and NCI-H660).
(G) LNCaPAPIPC grown in androgen- and AR-depleted conditions were treated with vehicle (DMSO) or 5 µM enzalutamide (ENZ). Growth was compared with parental LNCaPshAR/pATK cells in charcoal stripped serum (CSS), fetal bovine serum (FBS), or FBS + 1 µg/mL Dox ± ENZ. Solid lines, with DMSO vehicle; dotted lines, with ENZ. All values are normalized to day 0. Data are presented as mean ± SEM (n = 5 per data point).
(H and I) Transwell migration (H) and invasion assays (I) of LNCaPshAR/pATK and LNCaPAPIPC at baseline (no FBS gradient) and in response to a serum (FBS) gradient. Significance was determined using Student’s t test and data are presented as mean ± SEM (n = 4).
See also Figure S2.

