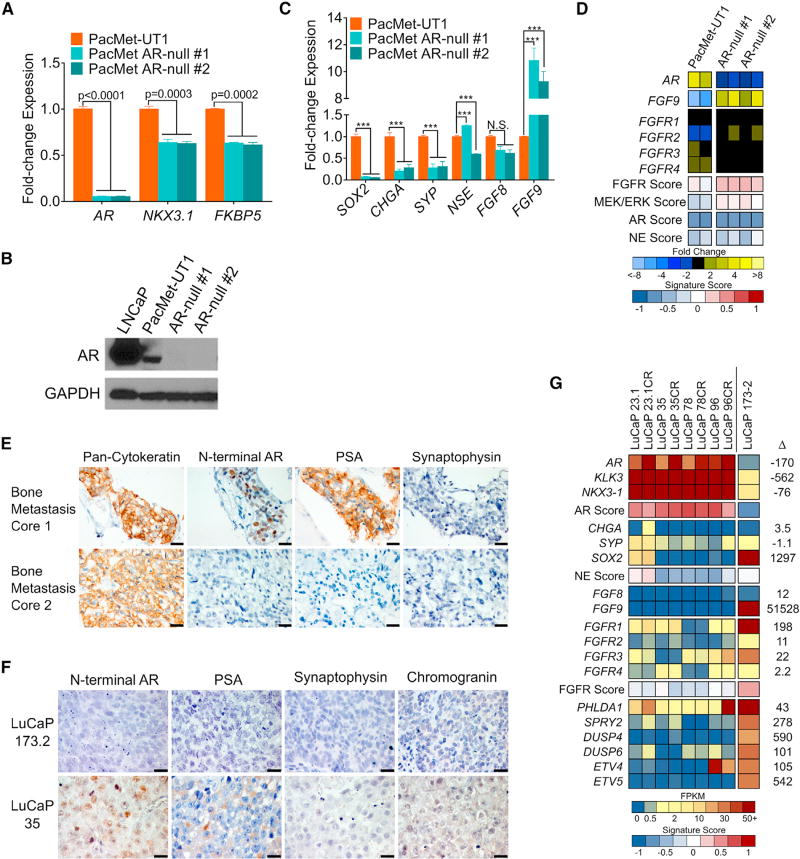
Figure 5. FGF Pathway and MAPK Activity in Cell Line and PDX Models of DNPC.
(A) Quantitation of the indicated transcripts by qRT-PCR in parental PacMet-UT1 cells and two independent PacMet-UT1 clones propagated after CRISPR/Cas9-mediated AR deletion.
(B) Western immunoblot of AR protein in the indicated cell lines.
(C) Quantitation of the indicated transcripts by qRT-PCR in the indicated cell lines. ***p < 0.0001. N.S., not significant.
(D) Expression of genes reflecting the activity of AR, neuroendocrine (NE), FGFR, and MAPK signaling in parental PacMet-UT1 cells and AR-null sublines. Measurements were derived from RNA-seq (n = 2 biological replicates per group).
(E) Cytokeratin, AR, PSA, and synaptophysin IHC in two independent rib metastases obtained from a patient with mCRPC. Scale bars, 20 µm.
(F) AR, PSA, synaptophysin, and chromogranin IHC in the LuCaP173.2 PDX model derived from rib metastasis core 2 (E) with comparisons with the AR-positive LuCaP35 PDX line. Scale bars, 20 µm.
(G) Expression of genes comprising the AR program, neuroendocrine (NE) program, and FGFR program in AR-positive castration-sensitive and castration-resistant (CR) PDX models (LuCaP23.1, LuCaP35, LuCaP78, and LuCaP96) and the AR-null, NE-null LuCaP173.2 PDX line. Measurements were derived from RNA-seq (n = one tumor from each LuCaP line.).
For (A) and (C), significance was determined by Student’s t test and data are presented as mean ± SEM (n = 3 replicates per data point). See also Figure S5.

