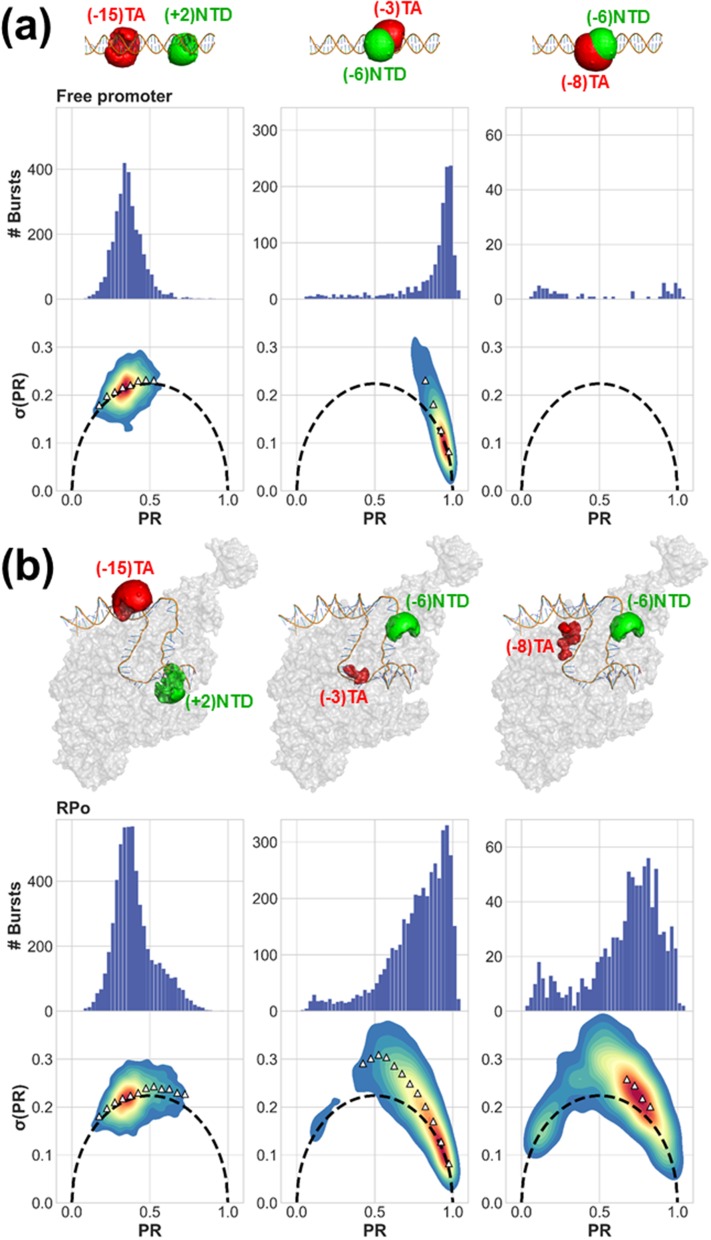
FIG. 2.
Qualitative assessment of smFRET dynamics using BVA. Proximity ratio (PR) histograms and BVA plots of σ(PR) versus PR show that (a) the free promoter is either characterized by a single PR population with no smFRET dynamics or with no PR population at all, due to quenching of FRET, and (b) RNAP bound to promoter DNA induces a unique PR subpopulation that exhibits smFRET dynamics. Depiction of differently labeled D-A constructs in free promoter (a) and RPo (b) states was generated by calculating D and A AVs (green and red surfaces, respectively) on top of DNA labeling positions in the context of RPo crystal structure (pdb code: 4XLN).

