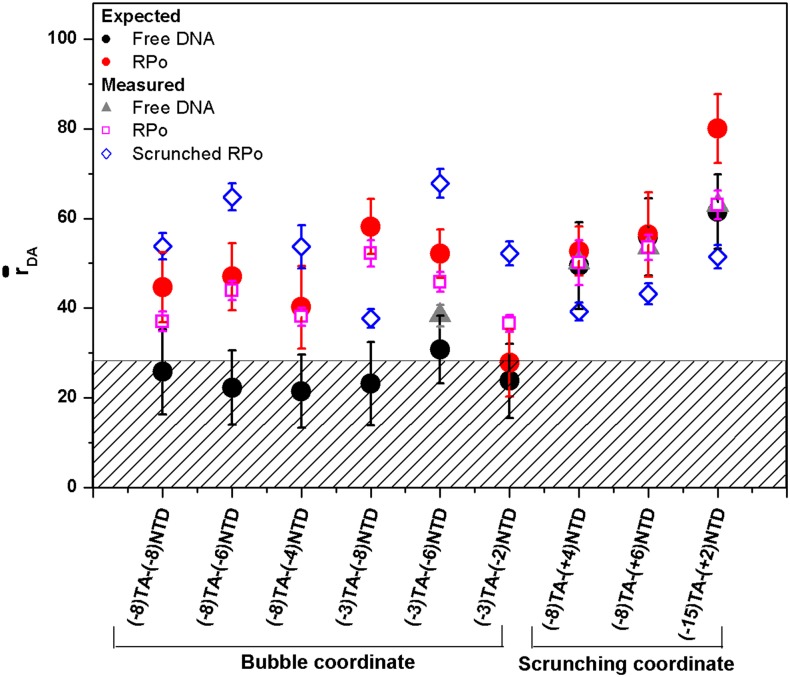
FIG. 3.
Comparison of measured apparent D-A distances, , with expected D-A distances, . The experimentally derived values of different conformational states for each D-A labeled lacCONS constructs are compared with the expected D-A distances from RPo crystal structure (pdb code: 4XLN) in free DNA (black dot) and in RPo (red dot). Two conformational states were found (with sub-millisecond underlying interconversion dynamics) in the RNAP-bound fraction. Their derived distance values are shown (magenta open squares) for the subset that defines a conformation closest to the known RPo structure. Distances for the other conformation are also shown (blue open diamonds). The values of the free promoter fraction are also presented (grey triangles; for the D-A labeled promoter constructs that do not exhibit quenched FRET). Quenched FRET constructs had an expected D-A distance below 0.5R0 (shown as shaded area). The error bars in the measured distances represent experimental standard error (Eq. S21 of the supplementary material). The error bars in the expected distances represent the D-A standard deviation, as calculated from all possible donor and acceptor positions in space (dye AVs).

