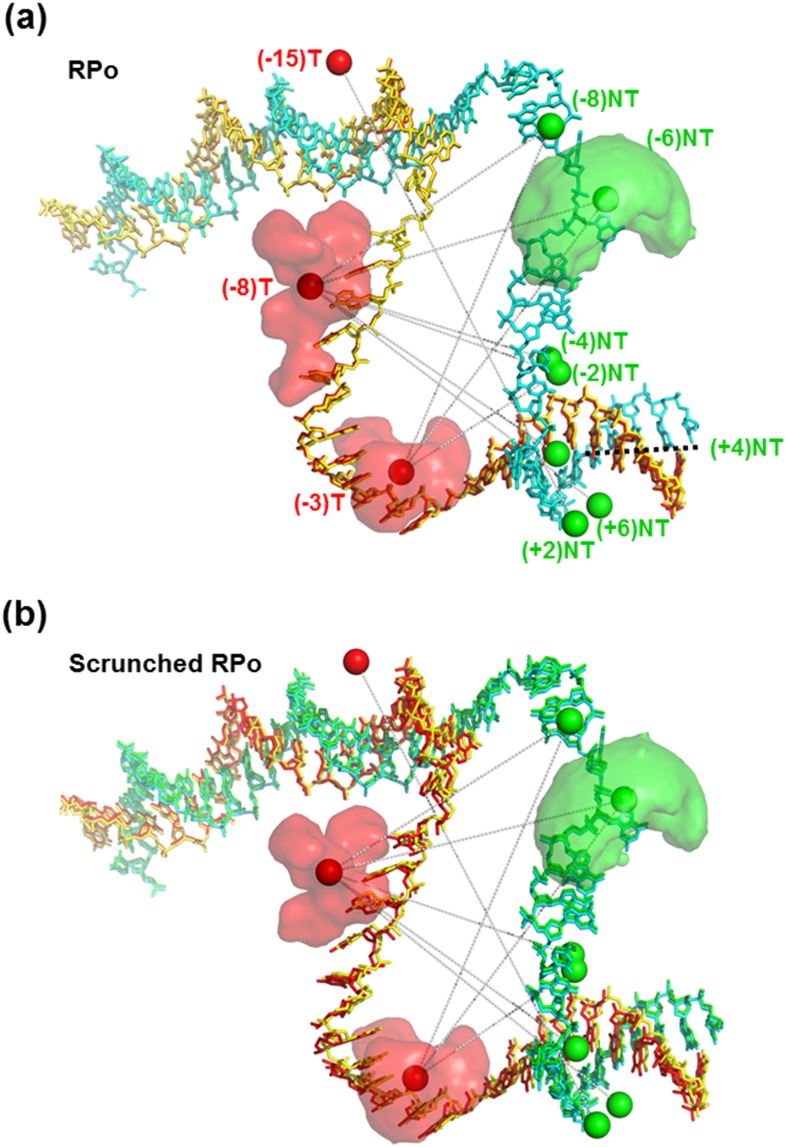
FIG. 4.
FPS analysis of transcription bubble conformational states. FPS analysis was performed for each conformational state against the known RPo structure (pdb code: 4XLN). (a) One set of apparent mean D-A distances, (RPo state), permits reconstruction of the template (T; red) and nontemplate (NT; green) strands in a 3D organization that matches the 3D organization of the T (yellow) and NT (cyan) strands in the crystal structure. (b) The second set (scrunched RPo state) yielded reconstruction of the template (T; red) and nontemplate (NT; green) strands in a 3D organization that does not match the 3D organization of the T (yellow) and NT (cyan) strands in the crystal structure. Solid spheres represent the mean positions of the D (green) and A (red) dyes. The set of mean D-A distances, , probed is shown by gray dotted lines connecting D and A mean positions. The mean position is always within the dyes’ AVs (3 examples of dye AVs are shown).

