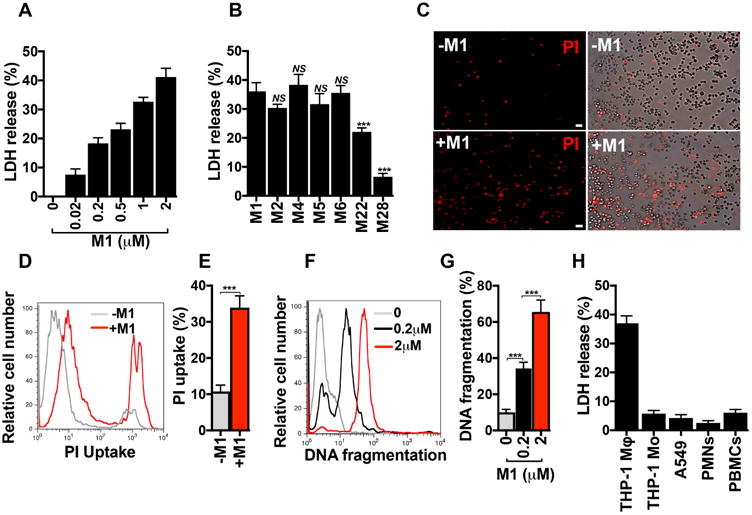
Figure 1.

GAS M1 protein promotes cell death in macrophages. a, Percentage of LDH released from THP-1 human macrophages (THP-1 Mϕ after 2 h treatment with increasing concentrations of recombinant purified M1 protein. b, Percentage of LDH released from THP-1 Mϕ incubated for 2 hours with M1 protein (2 μM) or other M proteins (2 μM). c, Fluorescence microscopy of propidium iodide (PI, red) uptake by THP-1 Mϕ that were untreated (-M1, top panels) or treated for 2 h with 2 μM M1 protein (+M1, bottom panels). Fluorescence images are shown on the left and merge of fluorescence and phase contrast images are shown on the right; scale bar = 30 μm. d, e, Flow cytometry analysis of PI uptake by THP-1 Mϕ that were untreated (-M1) or treated for 2 h with 2 μM M1 protein (+M1). A representative histogram of PI fluorescence is shown in panel d, and quantification of PI uptake as measured by percentage of cells with PI uptake (%) is shown in panel e. f, g, FACS analysis of TUNEL assay of THP-1 Mϕ treated with M1 (0.2 or 2 μM) or untreated (0) for 4h. Panel f shows a representative flow cytometry histogram of DNA fragmentation and panel g shows the percentage of cells with DNA fragmentation (%) compared with untreated cells (0). h, LDH release from THP-1 macrophages (THP-1 Mϕ), THP-1 monocytes (THP-1 Mo), A549 human alveolar basal epithelial cells (A549), primary human neutrophils (PMNs), and primary human peripheral blood mononuclear cells (PBMCs) treated for 2 h with M1 (2 μM). Data in panels a, b, e, g and h are plotted as the mean ± SEM and represent three independent experiments performed in triplicate and analyzed by Student's t-test. NS = not significant (P>0.05) and ***P<0.001. Panels c, d, and f, show representative images and flow cytometry histograms of three independent experiments.
