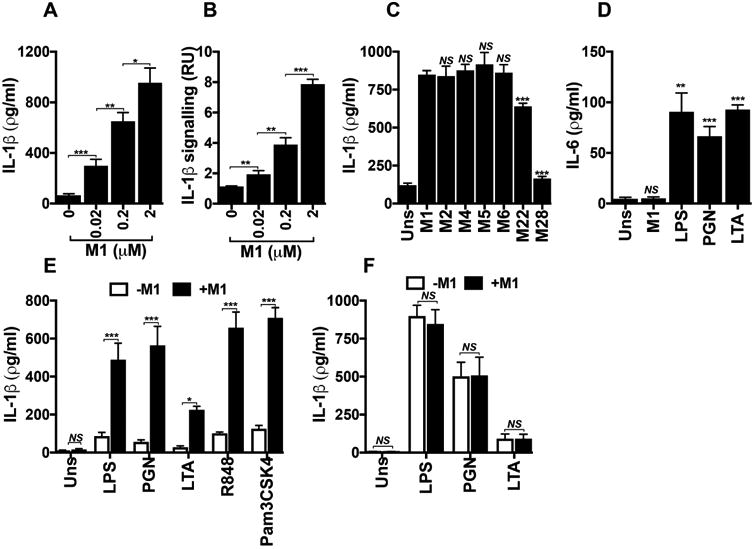
Figure 2. M1 protein provides a second signal that specifically triggers IL-1β signalling.

Total IL-1β (a) and the processed form of IL-1β (b) produced by THP-1 Mϕ incubated for 2 h with increasing concentrations of M1 protein, as measured by ELISA or by HEK-Blue™ IL-1R reporter cells, respectively. c, Comparison of total IL-1β measured by ELISA from THP-1 Mϕ incubated for 2 h with M1 (2 μM) or other M proteins (2 μM). d, IL-6 production assessed by ELISA from THP-1 Mϕ that were unstimulated (Uns) or stimulated for 15 h with M1 (0.02 μM), lipopolysaccharide (LPS, 100 ng ml-1), peptidoglycan (PGN, 1 μg ml-1), or lipoteichoic acid (LTA, 1 μg ml-1). IL-1β release measured by ELISA from mouse BMDMs (e) or human PBMCs (f) that were unprimed (Uns) or primed for 16 h with different TLR agonists: LPS (10 ng ml-1), PGN (1 μg ml-1), LTA (1 μg ml-1), R848 (1 μg ml-1), or Pam3CSK4 (10 ng ml-1). BMDMs and PBMCs were then untreated (-M1) or treated with 2 μM of M1 protein (+M1) for 2 h. Data in panels a-f are plotted as the mean ± SEM and represent three independent experiments performed in triplicate and analyzed by Student's t-test. NS = not significant (P>0.05), * P<0.05, ** P<0.01 and *** P<0.001),
