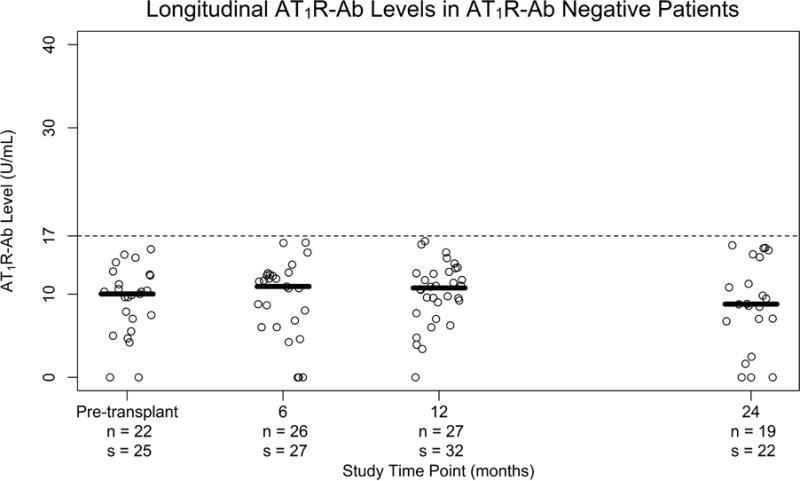
Figure 1. Comparison of AT1R-Ab Levels over 2 year Follow-Up Period.


in a) patients positive for AT1R-Ab at any time point and b) patients who were negative for AT1R-Ab at all time points. Each plot point represents an individual patient blood sample taken pre-transplant and at 6, 12, and 24 months after transplantation. The median AT1R-Ab level at a given time point is represented by the bar in relation to the AT1R-Ab positive threshold of >17 units/mL (dashed line). n= number patients s= number of samples
