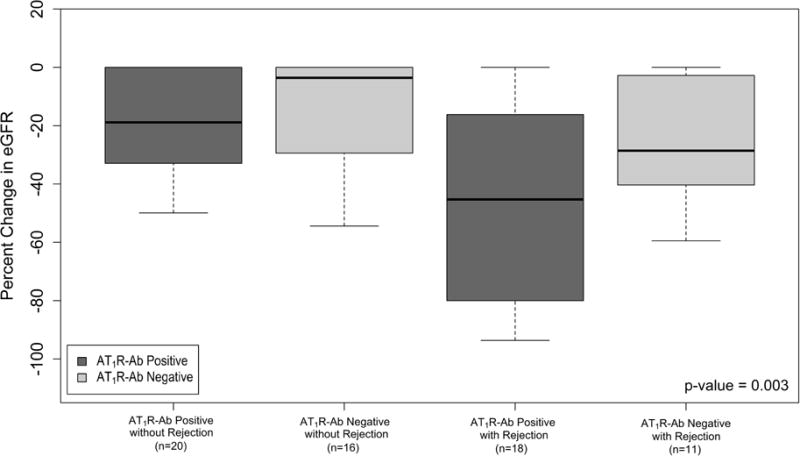
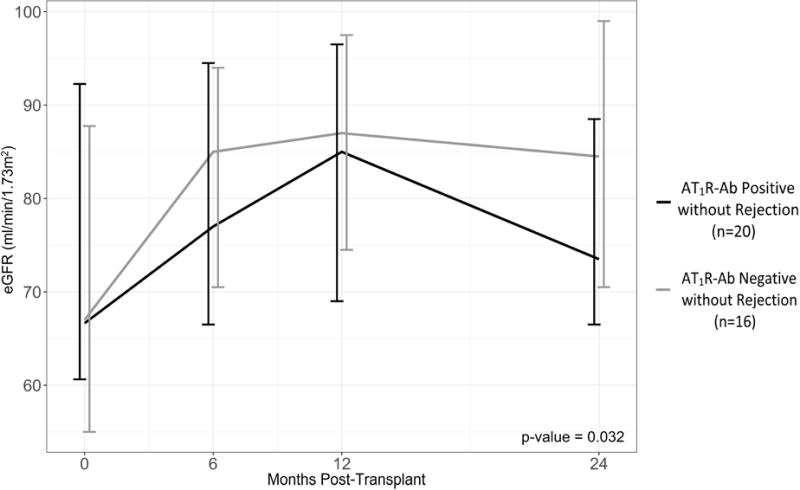
Figure 3. Relationship between Renal Function and AT1R-Ab.


Median percent change in eGFR by a) AT1R-Ab status and b) AT1R-Ab and Rejection Status shown, p-value for 4 group comparison. Percent change in eGFR was taken from hospital discharge to lowest eGFR value during the 2 year follow up period. c) The impact of AT1R-Ab status on eGFR over time in patients without rejection assessed by a mixed-effects regression model. Median eGFR and interquartile range at each time point post-transplant is shown. All patients in this analysis had developed AT1R-Ab by the 12 month time-point. Notably, patients with AT1R-Ab, in the absence of rejection, had progressive decline in renal function in contrast to patients who remained free from AT1R-Ab development over the 2 year period. β = 0.85 (0.00 – 1.69).
