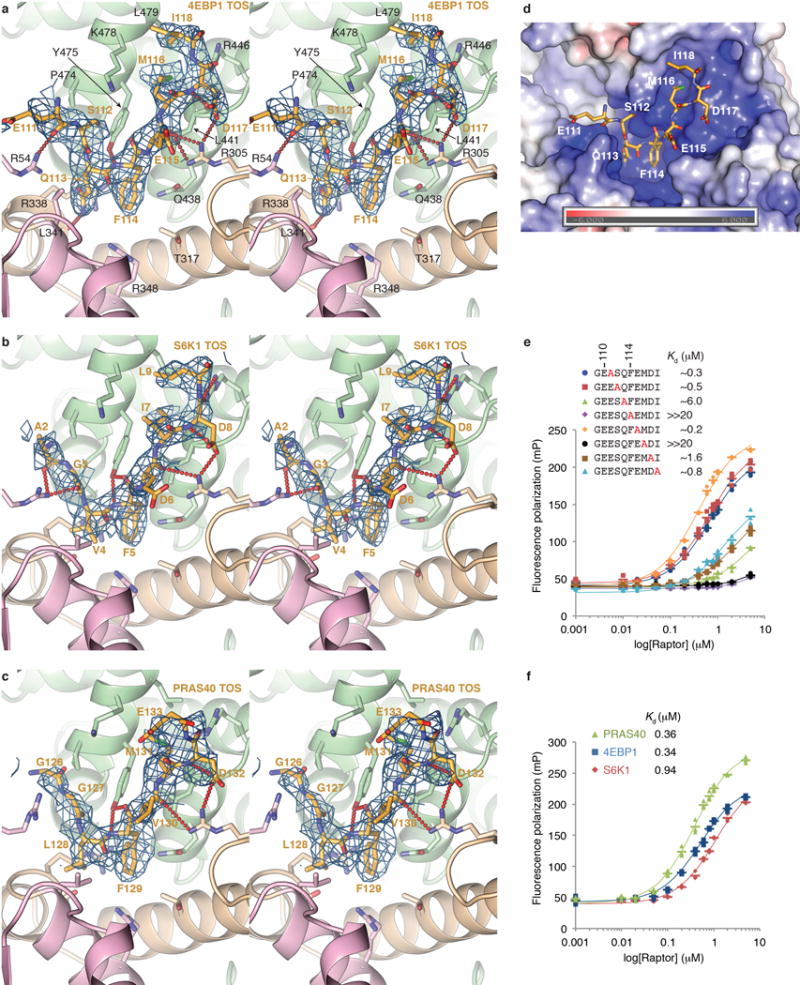
Extended Data Figure 3. AtRaptor-TOS motif crystal structures and human RAPTOR-TOS motif dissociation constants.

a, Stereo view of the mFo-dFc electron density of the atRaptor-4EBP199–118 co-crystals, calculated with phases from atRaptor before any 4EBP1 was built into the model. The structure is colored as in Figure 2b, and the map, calculated at 3.0 Å and contoured at 2.2 σ, is shown as blue mesh. Of 20-residues in the 4EBP1 peptide in the crystals, only the 8-residue segment shown is ordered. b, Stereo view of the mFo-dFc electron density, calculated as in a, of the atRaptor-S6K11–14 co-crystals. The 3.1 Å map is contoured at 2.2 σ. As with the 4EBP1 co-crystals, only 8 of the 14 S6K1 residues are ordered. c, Stereo view of the mFo-dFc electron density, calculated as in a, of the atRaptor-PRAS40124–139 co-crystals. The 3.35 Å map is contoured at 1.9 σ. Only 8 of the 16 PRAS40 residues are ordered. In addition, side chain of Glu133 has poor density and is only tentatively built. d, Molecular surface representation of the atRaptor TOS-binding groove, colored according to the electrostatic potential (–6 to +6 kT) calculated without the 4EBP1 peptide (shown as sticks) using APBS3 and illustrated with PyMOL. The TOS-binding groove has an overall basic electrostatic potential owing to five arginine and one lysine residues, explaining the tendency of acidic residues to be present at the non-conserved and flanking positions of the TOS motif. e, Binding of the indicated human 4EBP1 TOS mutant peptides (mutation in red) to human RAPTOR measured by fluorescence polarization anisotropy. Graph shows means as dashes and values from three independent experiments with the indicated markers and colors. Dissociation constants from the non-linear regression fitting of the data are also shown, and simulated binding curves are overlaid on the data. f, Binding of the TOS motif peptides of human 4EBP1 (blue), S6K1 (red) and PRAS40 (green) to human RAPTOR measured by fluorescence polarization anisotropy. Graph shows means as dashes and values from three independent experiments with the indicated markers and colors. Also shown are the dissociation constants from the non-linear regression fitting of the data and the simulated binding curves.
