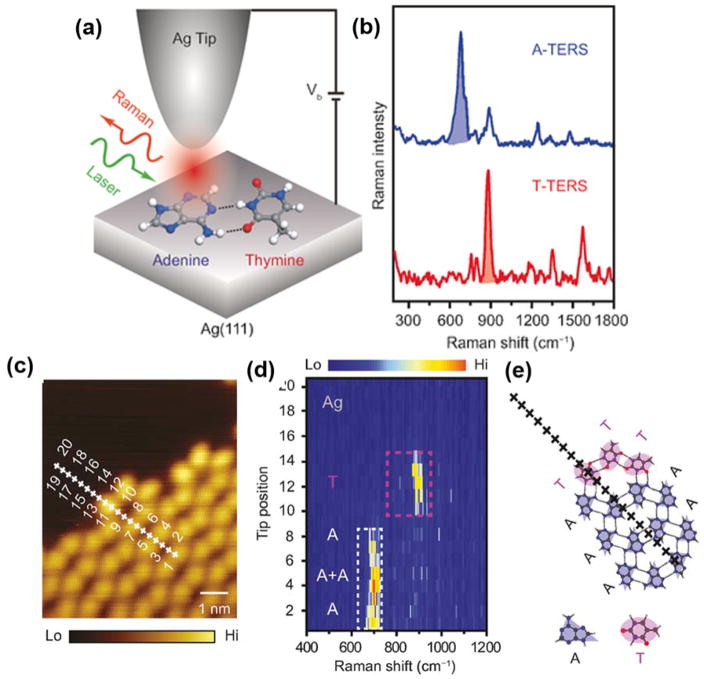
Figure 1.
(a) Schematic of STM-controlled TERS in a confocal-type side-illumination configuration on Ag (111) using Ag tips. (b) Representative TERS spectra of adenine (A, blue) and thymine (T, red). Each spectrum is normalized to the strongest peak (680 cm−1 in the TERS spectrum of A and 881 cm−1 in that of T) and then shifted vertically for clarity. (c) High-resolution STM imaging around the co-adsorption boundary. (d) Corresponding spectral evolution for 20 sequential TERS measurements along the line trace marked by crosses in (c) with a step size of 0.27 nm. (e) A proposed molecular arrangement along the line trace in (c). Reproduced from Distinguishing Individual DNA Bases in a Network by Non-Resonant Tip-Enhanced Raman Scattering, Zhang, R.; Zhang, X.; Wang, H.; Zhang, Y.; Jiang, S.; Hu, C.; Zhang, Y.; Luo, Y.; Dong, Z. Angew. Chem. Int. Ed. Engl., Vol. 56, Issue 20 (ref 46). Copyright 2017 Wiley.

