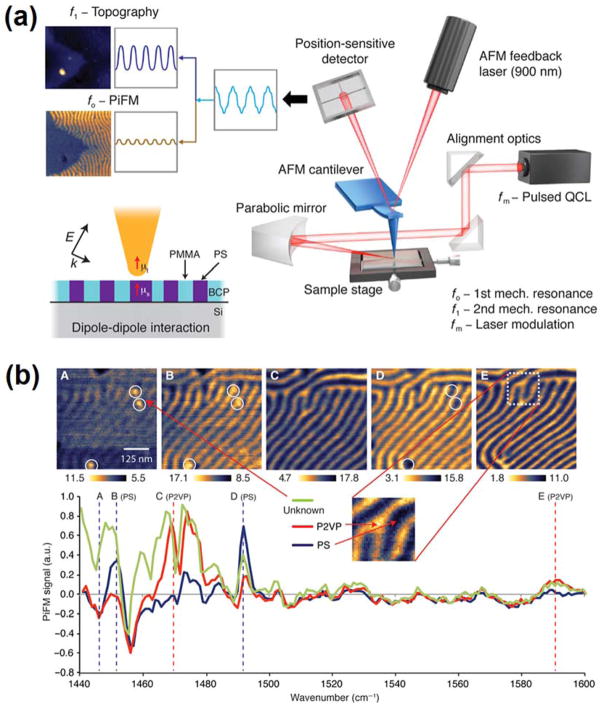
Figure 10.
(a) Schematic of an IR PiFM experiment. The incident mid-IR laser is electrically triggered to pulse at fm = f1 − f0, where f0 and f1 are the first and second mechanical eigenmode resonances of the cantilever. (b) Chemical imaging of PS-b-P2VP fingerprint patterns. PiFM imaging at (A–E) 1447 cm−1, 1452 cm−1, 1469 cm−1, 1492 cm−1, and 1589 cm−1. The PiFM point spectra taken from the locations shown in (A), (B), and (E) were normalized against a Si background. Reproduced from Nowak, D., Morrison, W., Wickramasinghe, H.K., Jahng, J., Potma, E., Wan, L., Ruiz, R., Albrecht, T.R., Schmidt, K., Frommer, J. and Sanders, D.P., 2016. Nanoscale chemical imaging by photoinduced force microscopy. Science advances, 2(3), p.e1501571 (ref 220), under creative commons license.

