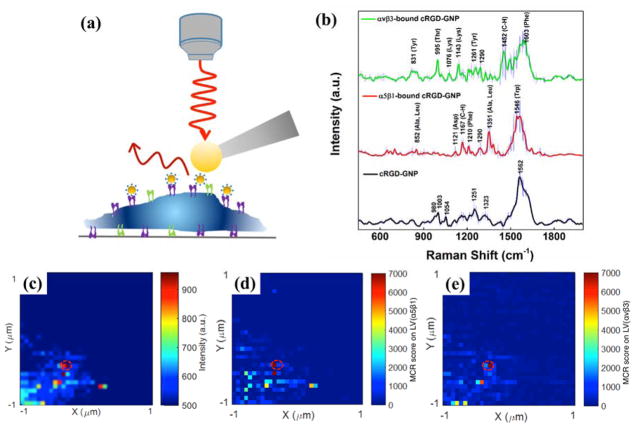
Figure 2.
(a) Schematic illustration of TERS detection of integrin receptors in cell membrane. (b) Average SERS spectra of cRGD-GNPs, α5β1-bound cRGD-GNPs, and αvβ3-bound cRGD-GNPs. Shaded area represents standard deviation. (c) TERS map of SW480 cells incubated with cRGD-GNPs, constructed with single-peak intensity at 1003 cm−1. Pixel step: 62.5 nm. (d, e) MCR score maps reflecting the localization of (d) α5β1 and (e) αvβ3 on the same cell membrane area as (c). Reproduced from Xiao, L.; Wang, H.; Schultz, Z. D. Anal. Chem. 2016, 88, 6547–6553 (ref 89). Copyright 2016 American Chemical Society.

