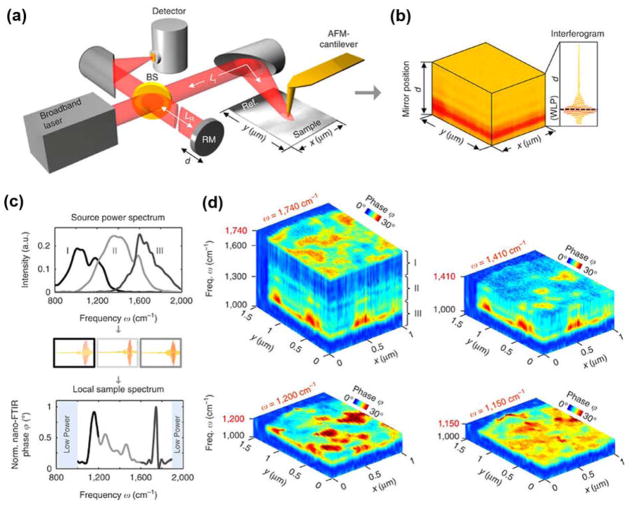
Figure 5.
(a) Set-up employing a mid-infrared laser continuum source for tip illumination. The tip scans the sample surface while at each pixel the light backscattered from the tip is analyzed with a Michelson interferometer that is operated as a Fourier transform spectrometer. The setup comprises a beam splitter (BS, uncoated ZnSe), a reference mirror (RM) and a detector. (b) 2D array of interferograms. (c) Top: Output spectra of the source. Middle: Interferograms recorded for each output spectrum. Bottom: Broadband nano-FTIR spectrum composed by three nano-FTIR spectra obtained by Fourier transform of the corresponding interferograms and normalization to a reference spectrum (middle panel). (d) Hyperspectral infrared data cubes of spectral resolution of 35 cm−1, cut at different frequencies ω. They show the normalized phase ϕ of the tip-scattered light as a function of position (x, y) and frequency ω. Reproduced by permission from Macmillan Publishers Ltd: Nature Communications, Amenabar, I.; Poly, S.; Goikoetxea, M.; Nuansing, W.; Lasch, P.; Hillenbrand, R. Nat. Commun., 2017, 8, 14402 (ref 118). Copyright 2017.

