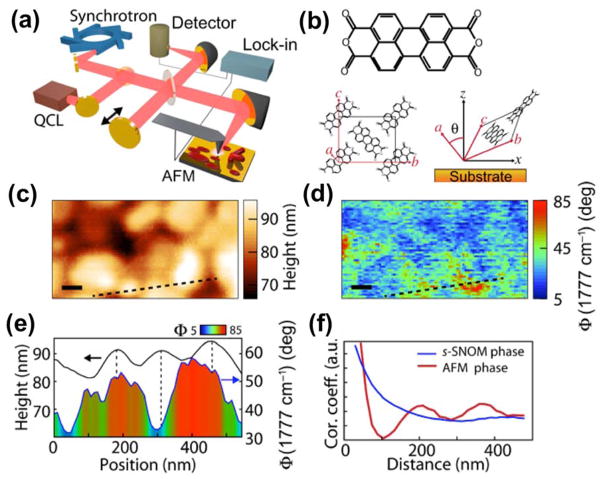
Figure 6.
(a) Schematic of IR s-SNOM using both synchrotron and QCL radiation. (b) Lewis structure (top) and crystal structure (bottom) of PTCDA in the β phase. (c) Topography and (d) s-SNOM phase ΦNF (ν̄) images of PTCDA. Scale bars, 100 nm. (e) Line cut of AFM height and ΦNF (ν̄) along the dashed transect indicated in (c) and (d), showing that molecular orientation is uncorrelated with topographic features. (f) Radial correlation function (red) of the AFM tapping phase, indicating the presence of 3D islands with characteristic size and spacing and ΦNF (ν̄) (blue), which shows an extended correlation length of crystallite orientation. Reproduced from Muller, E.A.; Pollard, B.; Bechtel, H.A.; van Blerkom, P.; Raschke, M.B. 2016. Infrared vibrational nanocrystallography and nanoimaging. Science advances, 2(10), p.e1601006 (ref 143), under creative commons license.

