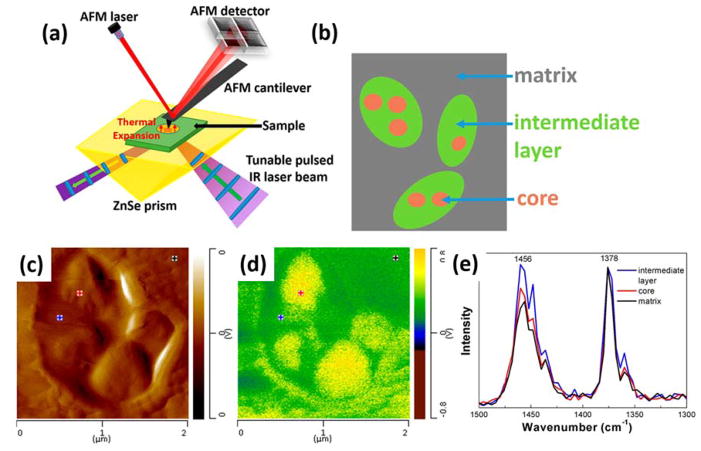
Figure 7.
Schematic illustration of the AFM-IR setup (a) used to analyze the composition of nanodomains in HIPP (b). (c) AFM height image and (d) AFM-IR map of the methyl symmetric C–H bending at 1378 cm−1. (e) AFM-IR spectra taken at the locations marked in (c) and (d), normalized to the 1378 cm−1 band, indicative of different ethylene contents as shown by the intensity of the 1456 cm−1 band. Reproduced from Tang, F.; Bao, P.; Su, Z. Anal. Chem. 2016, 88, 4926–4930 (ref 169). Copyright 2016 American Chemical Society.

