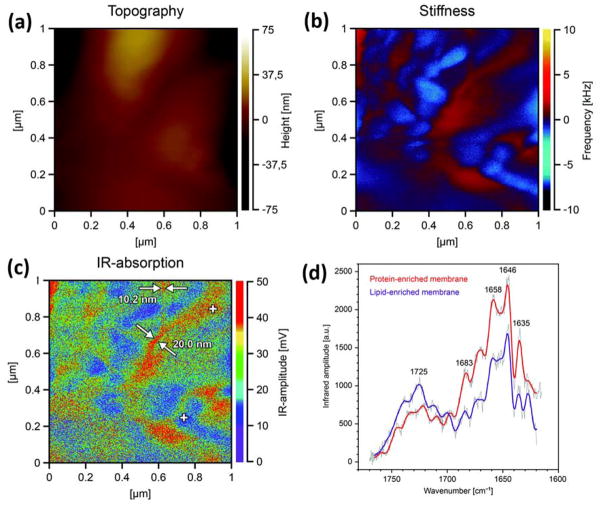
Figure 9.
(a) Surface topography, (b) mechanical-stiffness map and (c) IR-absorption pattern of the lipoprotein multi-bilayer recorded simultaneously on 1 × 1 μm area of the sample, the thickness of which was approximately 1.2 μm. (d) IR-absorption spectra of the lipoprotein multi-bilayer. The spectra were recorded at the positions denoted with white crosses in (c): the trace drawn in red (protein-enriched membrane) corresponds to the cross in the upper portion of the image and the one drawn in violet (lipid-enriched membrane) to that in its lower portion. The spectra were recorded in the amide-I region of the protein wavenumber range: (1600–1700 cm−1) and in the ester carbonyl stretching region of the lipid components’ wavenumber range: (1700–1750 cm−1). Reproduced from Gruszecki, W.I.; Kulik, A.J.; Janik, E.; Bednarska, J.; Luchowski, R.; Grudzinski, W.; Dietler, G. Nanoscale 2015, 7, 14659–14662 (ref 191), with permission of The Royal Society of Chemistry.

