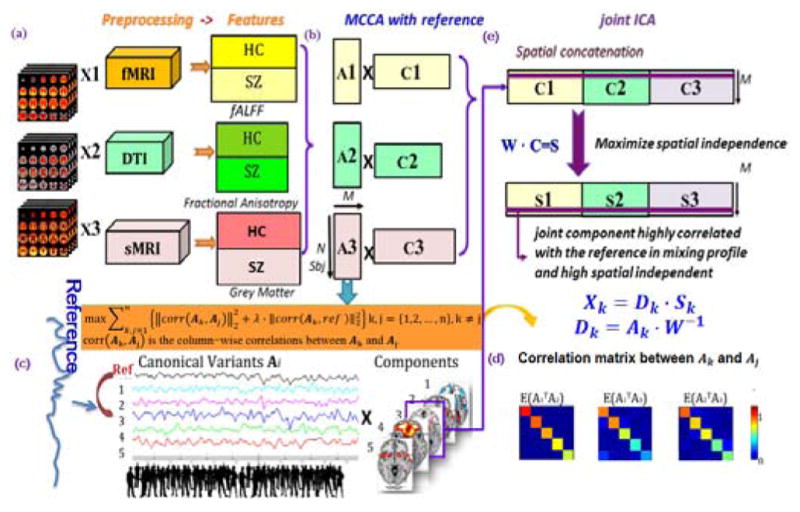
Fig. 1.

Flowchart of the supervised 3-way data fusion strategy of MCCAR+jICA. As an example, the feature matrix of each modality is decomposed as 5 independent components (ICs), M=5. (a) Data preprocessing and stacked to 2D matrix for each modality. (b) represents multi-site canonical correlation analysis with reference (MCCAR) and its objective function. (c) illustration of MCCAR when M=5 and the 3rd component is linked with reference, resulting in 3 canonical variants Ak, whose pair-wise covariation of is a diagonal matrix as shown in (d). (e) indicate the joint independent component analysis (jICA).
