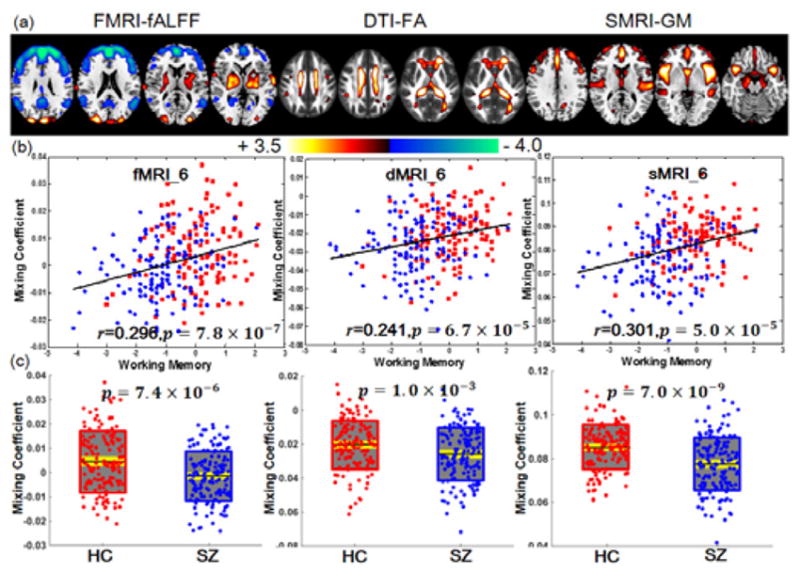
Fig. 7.

Joint components that are significantly correlated with working memory domain score of CMINDS and also indicate significant group differences in all modalities. (a) The spatial maps visualized at |Z|>2; the positive Z-values (red regions) means HC>SZ and the negative Z-values (blue regions) means HC<SZ. (b) Correlations between loadings of component and the CMINDS working memory scores (HC: red dots, SZ: blue dots); the higher loadings correspond to better working memory performance. (c) Boxplot of the loading parameters for each component, with the p values of two sample t-test between HC and SZ. In (c), the black line, gray patch and yellow patch represent mean, SD and SEM of the group loadings.
