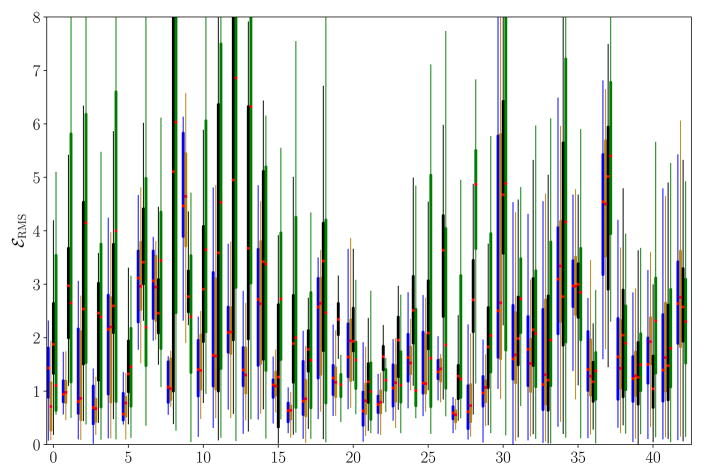
Fig. 9.
Boxplots of the root mean square error per keypoint trajectory for the cardio-respiratory (left), respiratory (middle left), and cardiac motion model (middle right) and for the static baseline (right). Trajectories 0–30 are dominated by respiratory motion, while the others are mostly influenced by cardiac motion. Best viewed in color.

