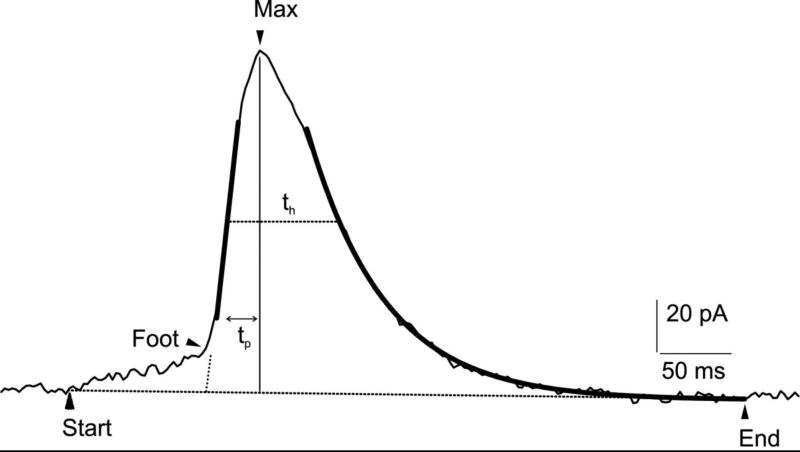
Fig 1.
Amperometric spike recorded from a bovine chromaffin cell using a carbon fiber electrode (CFE). The distinct phases of the exocytotic event (foot, rising phase, decaying phase) can be quantified, as detailed in the text. Arrows indicate the event duration (start, end) and the presence of the foot (oblique dashed line). Thick lines represent the ascending slope on the rising phase and spike exponential decay. max: indicates the maximum oxidation current. tp is the time to reach the spike maximum. Analysis performed using the software “Quanta Analysis”, by Eugene Mosharov (57).

