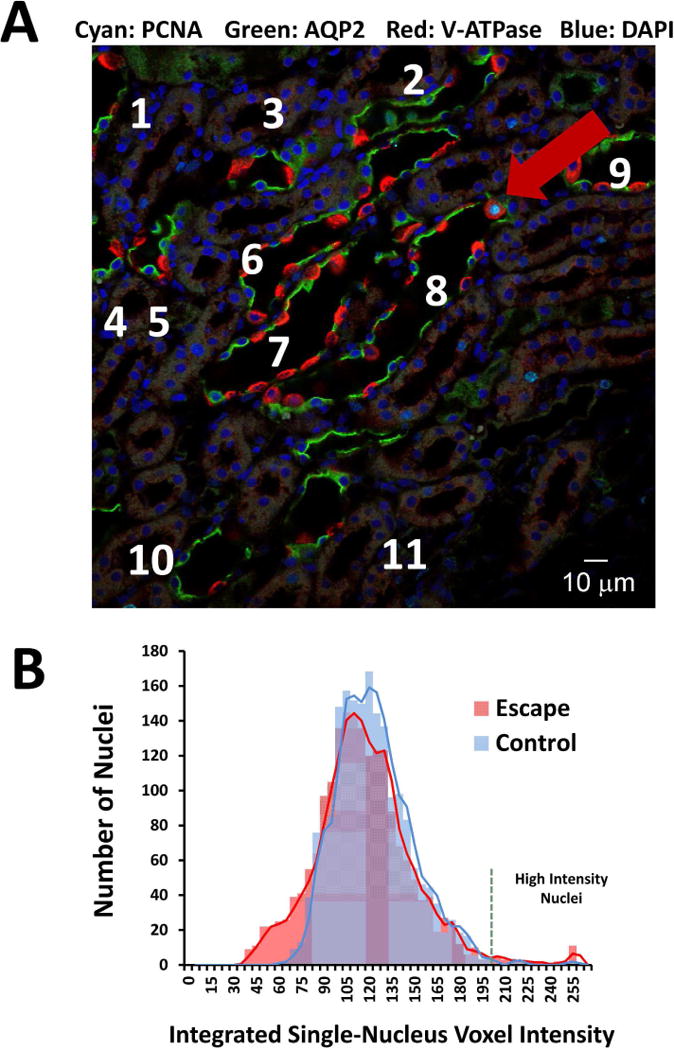
Figure 11. Cell cycle indices in renal CCDs from vasopressin-escape versus control rats.

A. Nuclei labeled with antibody to PCNA (S-phase marker) are scarce. Image shows section of renal cortex from rat undergoing vasopressin-escape (Day 2). Labeling for AQP2 (green) and the B1 subunit of the vacuolar proton-ATPase (red) identify collecting ducts (numbered). A single collecting duct cell with PCNA labeling (cyan) is seen (red arrow). DAPI, blue. B. Distribution of integrated DAPI fluorescence signal in nuclei of microdissected CCDs from rats undergoing vasopressin-escape (Day 4 of escape protocol) versus control rats. See Table 8 for quantitation.
