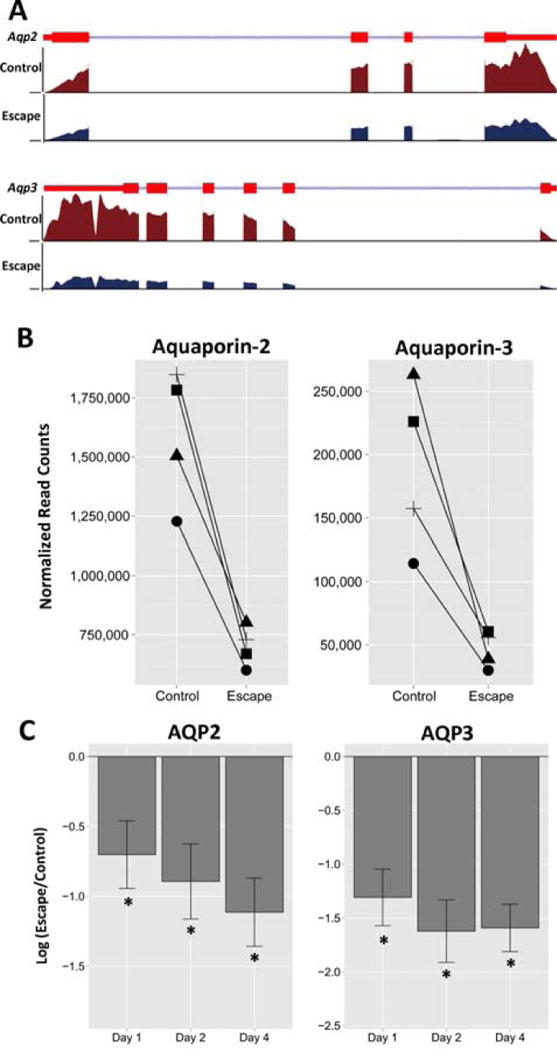
Figure 3.

Abundances of aquaporin-2 (AQP2) and aquaporin-3 (AQP3) transcripts in the CCD are decreased in vasopressin-escape animals. A. RNA-Seq reads are mapped to the RefSeq transcript models of for rat Aqp2 gene (top) and Aqp3 gene (bottom). For each RefSeq transcript, exons are shown as red rectangles and introns as blue lines connecting the exons. Barbs indicate direction of transcription. The coverage was calculated as the number of reads per million nucleotides in the whole genome. B. Normalized RNA-Seq read counts for Aqp2 and Aqp3 in the CCD segments obtained from four pairs (control versus escape animals) at day 2. C. Change in AQP2 and AQP3 transcript abundances in the microdissected CCDs on different days relative to time controls (*Padj < 0.05 for escape vs control at each time point, paired t-test).
