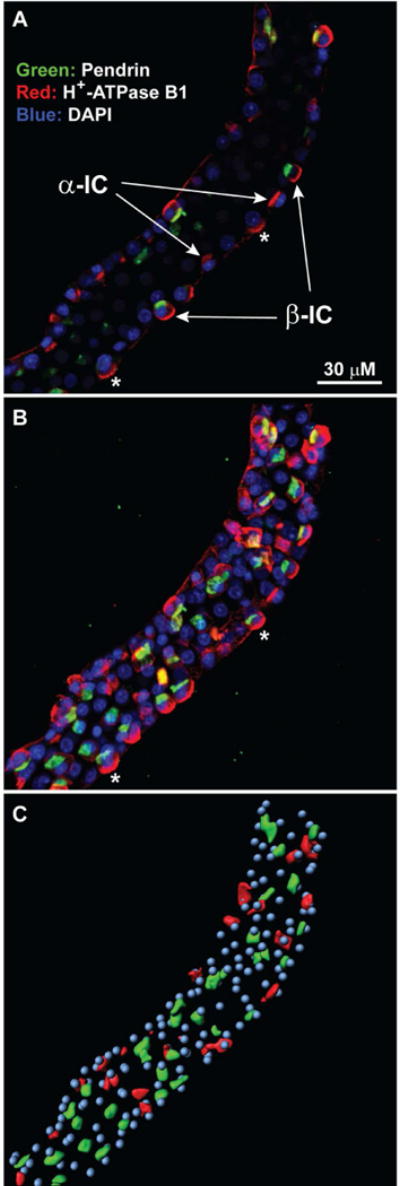
Figure 8. Cell counting in immunofluorescently labeled CCDs microdissected from rats.

After microdissection, tubules were fixed with paraformaldehyde followed by immunofluorescence staining for intercalated cells (using pendrin and H+-ATPase antibodies) and nuclei (DAPI). A. Standard confocal fluorescence image of a microdissected CCD from a control vasopressin-treated rat. Pendrin, green; B1 H-ATPase, red; DAPI labeling of nuclei, blue. Examples of identified α-intercalated cells (α-IC) and β-intercalated cells (β-IC) are pointed out. Asterisks indicate cells that appear to lack pendrin labeling in confocal image but are revealed to be β-intercalated cells in the 3D reconstruction. B. Maximum intensity projection of 3-D reconstructed tubule image generated by IMARIS image analysis software. Colors are the same as in Panel A. Asterisks mark the same cells indicated in Panel A. C. IMARIS-generated analytical image. The pendrin-positive IC cells and non-pendrin IC cells were labeled in green and red, respectively, based on IMARIS surface and spot analysis tools. Nuclei are shown in cyan. For details, see Supplemental Figure 2.
