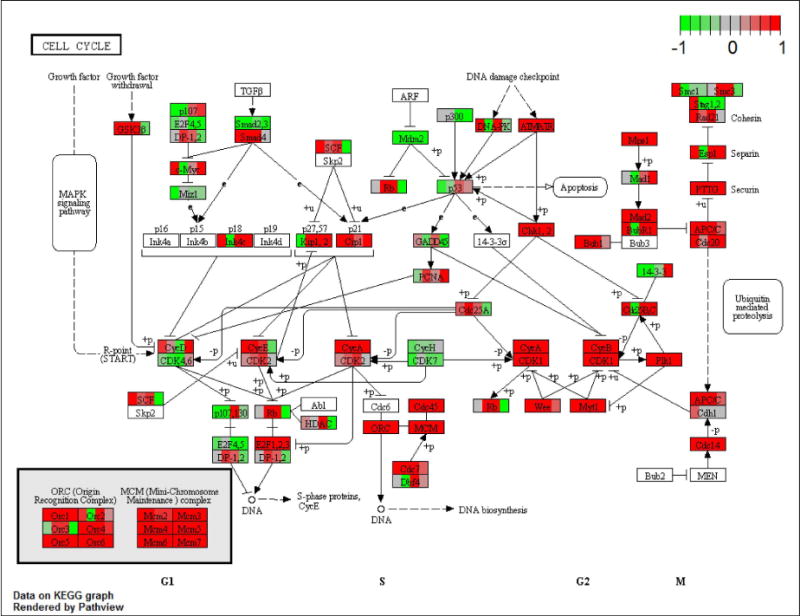
Figure 9.

Transcripts corresponding to most genes present in the KEGG Cell Cycle Pathway were increased in abundance in CCDs from rats on Day 2 of development of vasopressin-escape. Values for all four Day-2 replicates are shown as individual blocks colored to show magnitude of change (red, increased; green, decreased) as generated by Bioconductor Pathview software (https://www.bioconductor.org/packages/devel/bioc/html/pathview.html) run on R. The specific values are available in Supplementary Dataset 1.
