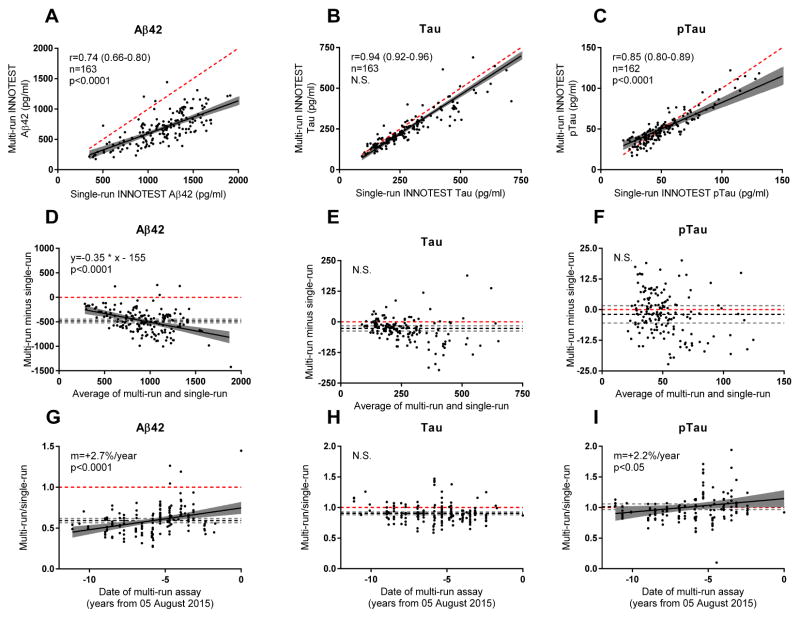
Fig. 1. Comparison of multi-run and single-run INNOTEST values.
Multi-run values were positively correlated with single-run INNOTEST values for (A) Aβ42, (B) tau and (C) ptau. Bland-Altman plots were used to compare multi-run and single-run values for (D) Aβ42, (E) tau and (F) ptau. Multi-run values, as compared to single-run values, increased over time for (G) Aβ42 and (I) ptau but not (H) tau. Each point represents one CSF sample from one individual. The black solid line represents the best fit regression line. The grey region surrounding the regression line represents the 95% confidence intervals for the regression line. The dashed red line represents identity, which would occur if the multi-run value equaled the single-run value. For D–I, the black dashed line represents the mean of all the values and the dashed grey lines represent the 95% confidence intervals of the mean. The Spearman correlation coefficient (r), number of individuals (n), and slope (m) is represented. The p value indicates whether the slope of the regression line is significantly different from the slope of the identity line (the slope of the identity line is 1 for A–C and 0 for D–I). August 5, 2015 refers to the last assay date in the multi-run dataset.

