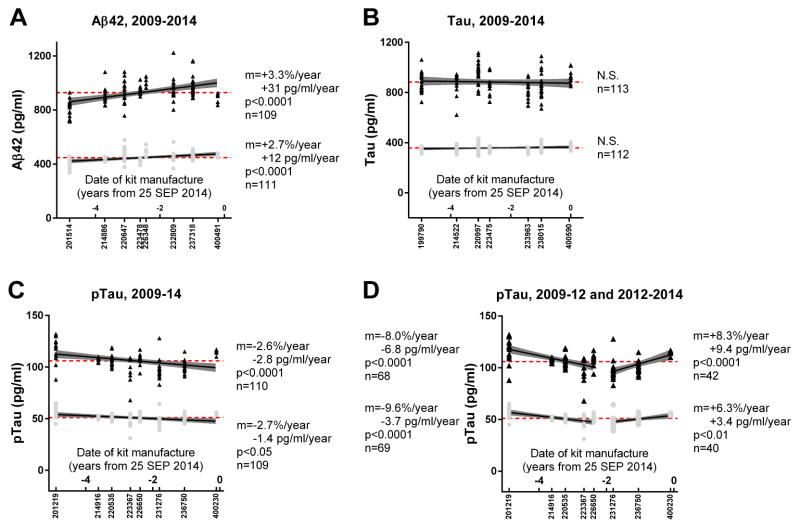
Fig. 3. Values for two samples measured with multiple INNOTEST assay lots manufactured over 5 years.
Values for (A) Aβ42, (B) tau and (C–D) ptau for aliquots of two pooled CSF samples from VUMC. Black points represent values for one sample; grey points represent values for a second sample. The lot number is listed below the X-axis, and the distance along the X-axis corresponds to the relative date of kit manufacture. The dashed red line represents the average value for the sample including all measurements. The change in assay values over time (m), whether the values change significantly over time (p) and the total number of measurements for each sample (n) are represented. For D, the information corresponding to the first five assay lots is listed on the left and the information corresponding to the last three assay lots is listed on the right.

