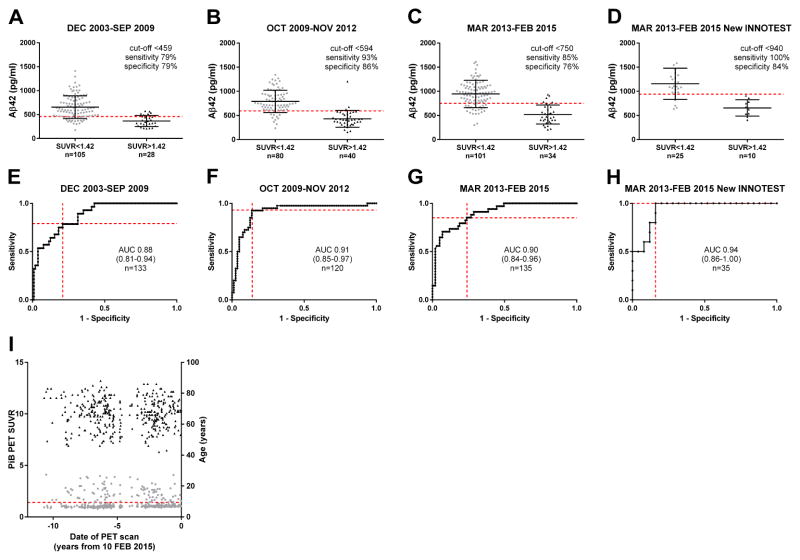
Fig. 4. Aβ 42 cut-off value corresponding to a positive PiB PET scan for different assay periods.
The WUSTL cohort was split into similarly sized groups representing three different assay periods: (A, E) December 2003-September 2009, (B, F) October 2009-November 2012 and (C/G) March 2013-February 2015. A subset of the group in (C, G) that was measured with the New INNOTEST assay was also analyzed (D, H). ROC analyses comparing Aβ42 levels with cortical PiB PET positivity were performed for the different groups, and the ROC curves are shown in E–H with the area under the curve (AUC) and the number of individuals (n) represented. Aβ42 cut-offs that corresponded to PiB PET positivity (SUVR>1.42) were determined. The sensitivity and specificity of the cut-offs are shown by red dashed lines in E–H. The cut-offs were applied to the groups in A–D and are represented by dashed red lines. I demonstrates the stability of PiB PET standardized uptake value ratio (SUVR) over time. Black points are age (right Y-axis) at the time of scan, and grey points are PiB PET SUVR (left Y-axis). The dashed red line represents the cut-off for a positive SUVR (>1.42).

