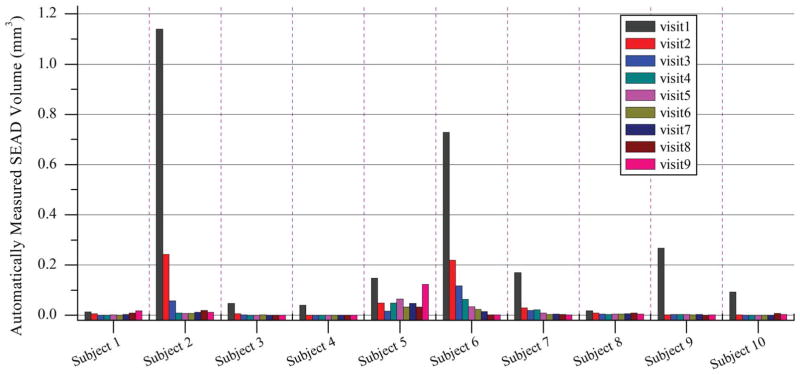
Fig. 10.
Longitudinal analysis of 10 subjects, each with 9 OCT scans from 9 visit taken at week 0, 2, 4, 6, 8, 10, 12 for the first standard 12-week treatment and two more scans during the patient specific treatment period. With anti-VEGF treatment, most of the patients showed a consistent decrease in SEAD volume. However, there are a few exceptions. For example, subject 5 showed a relatively stable SEAD volume over the 9 visits.

