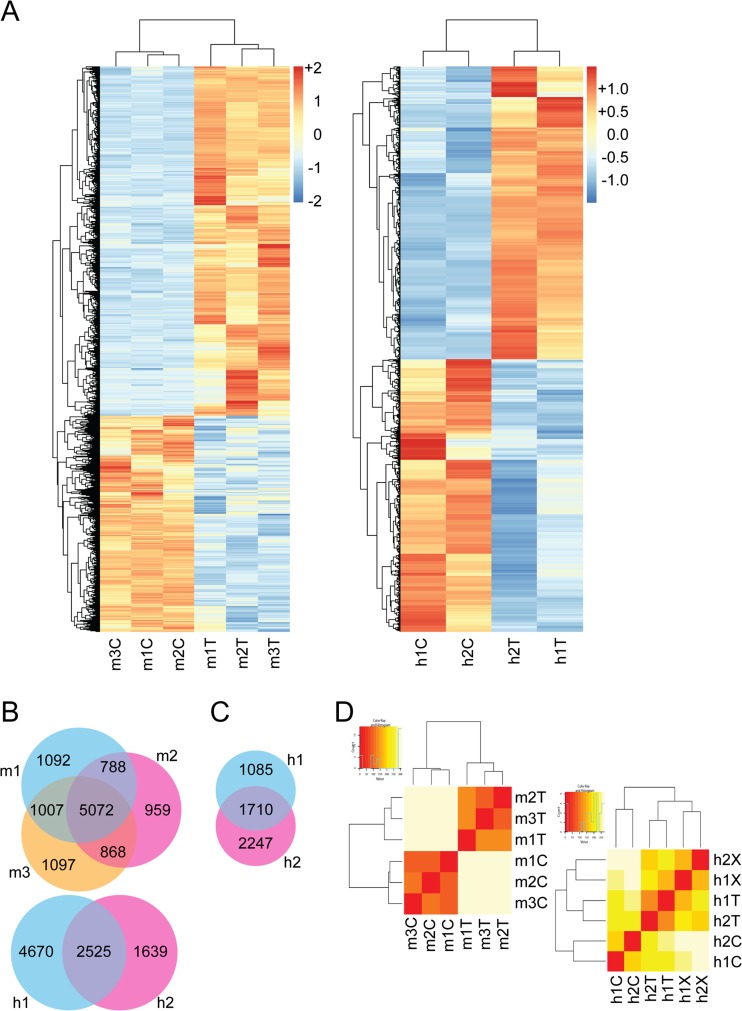
Fig. 2.
Mouse and human synovial sarcoma transcriptional comparisons. a Heatmap demonstrating distribution of 10,833 and 8834 differentially expressed genes between tumors and cell lines from mice (left) and humans (right). b Venn diagrams showing significant overlapping genes between mouse (above) and human (below) samples, comparing cell lines to primary tumors. c Venn diagram showing 2-fold change overlapping genes shared as different in the same direction between the two primary tumor to xenograft comparisons from human tumors. d Hierarchal clustering of primary tumor and cell line transcriptome profiles for mouse and human samples, (left and right, respectively). T = primary tumor; C = cell line; X = xenograft

