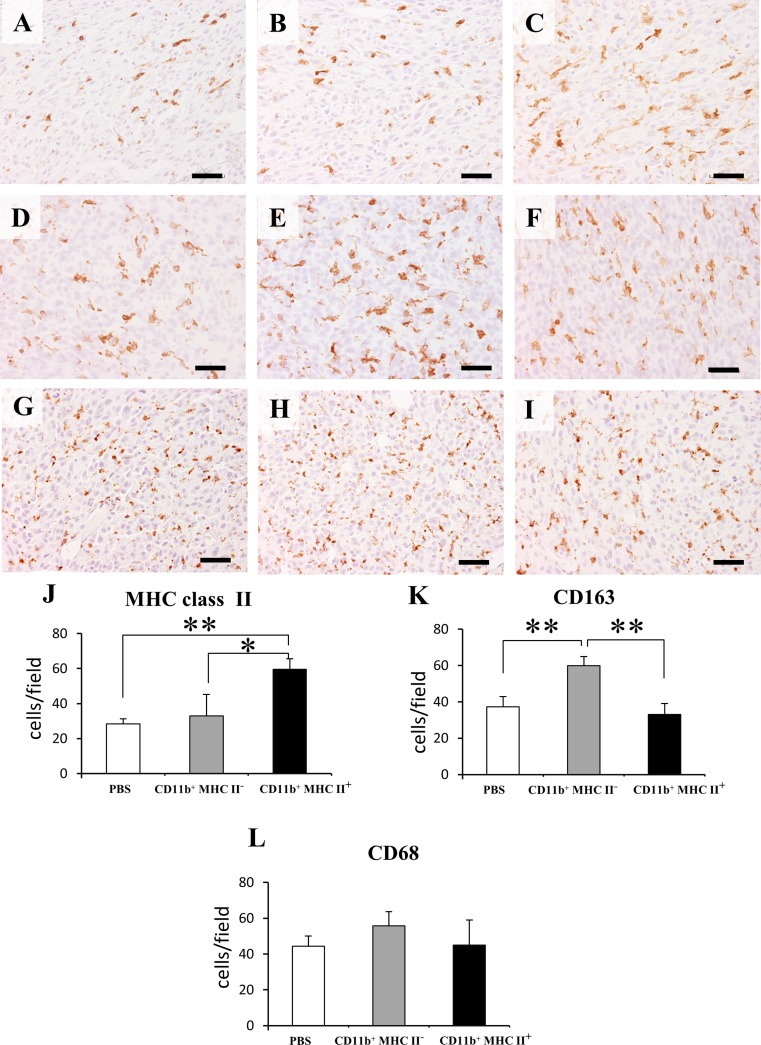
Fig. 10.
Immunohistochemistry for MHC class II in: control RMM tumors (a), RMM tumors treated with CD11b+ MHC class II− cells (b) and RMM tumors treated with CD11b+ MHC class II+ cells (c). Immunohistochemistry for CD163 in. control RMM tumors (d), RMM tumors treated with CD11b+ MHC class II− cells (e) and RMM tumors treated with CD11b+ MHC class II+ cells (f). Immunohistochemistry for CD68 in. control RMM tumors (g), RMM tumors treated with CD11b+ MHC class II− cells (h) and RMM tumors treated with CD11b+ MHC class II+ cells (i). Graphic representation of cell counts for MHC class II+ cells (j), CD163+ cells (k) and CD68+ cells (l). Tukey’s test, *P < 0.05, **P < 0.001, significantly different between groups indicated by bars

