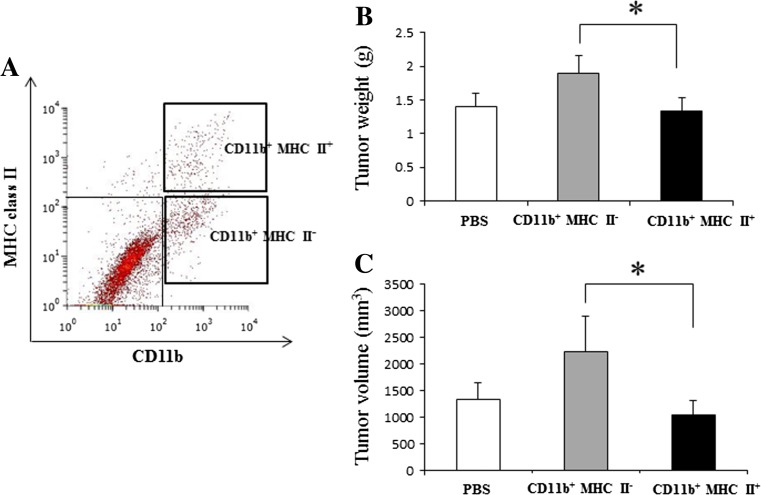
Fig. 9.
Adoptive transfer of myeloid cell subsets into RMM tumor-bearing rats (0.5 cm tumors). (a) Cell sorting from RMM tumors of 2 cm (n = 4); bold quadrants represent the CD11b+ MHC class II+ and CD11b+ MHC class II− cell populations selected for adoptive transfer. 104 cells from each subpopulation were injected into F344 rats (n = 3 for each group), and PBS was used as control. (b) Graphic representation of tumor weight at day 7 post-adoptive transfer. (c) Graphic representation of tumor volume at day 7 post-adoptive transfer. Tukey’s test, *P < 0.05, significantly different between groups indicated by bars

