Fig. 7.
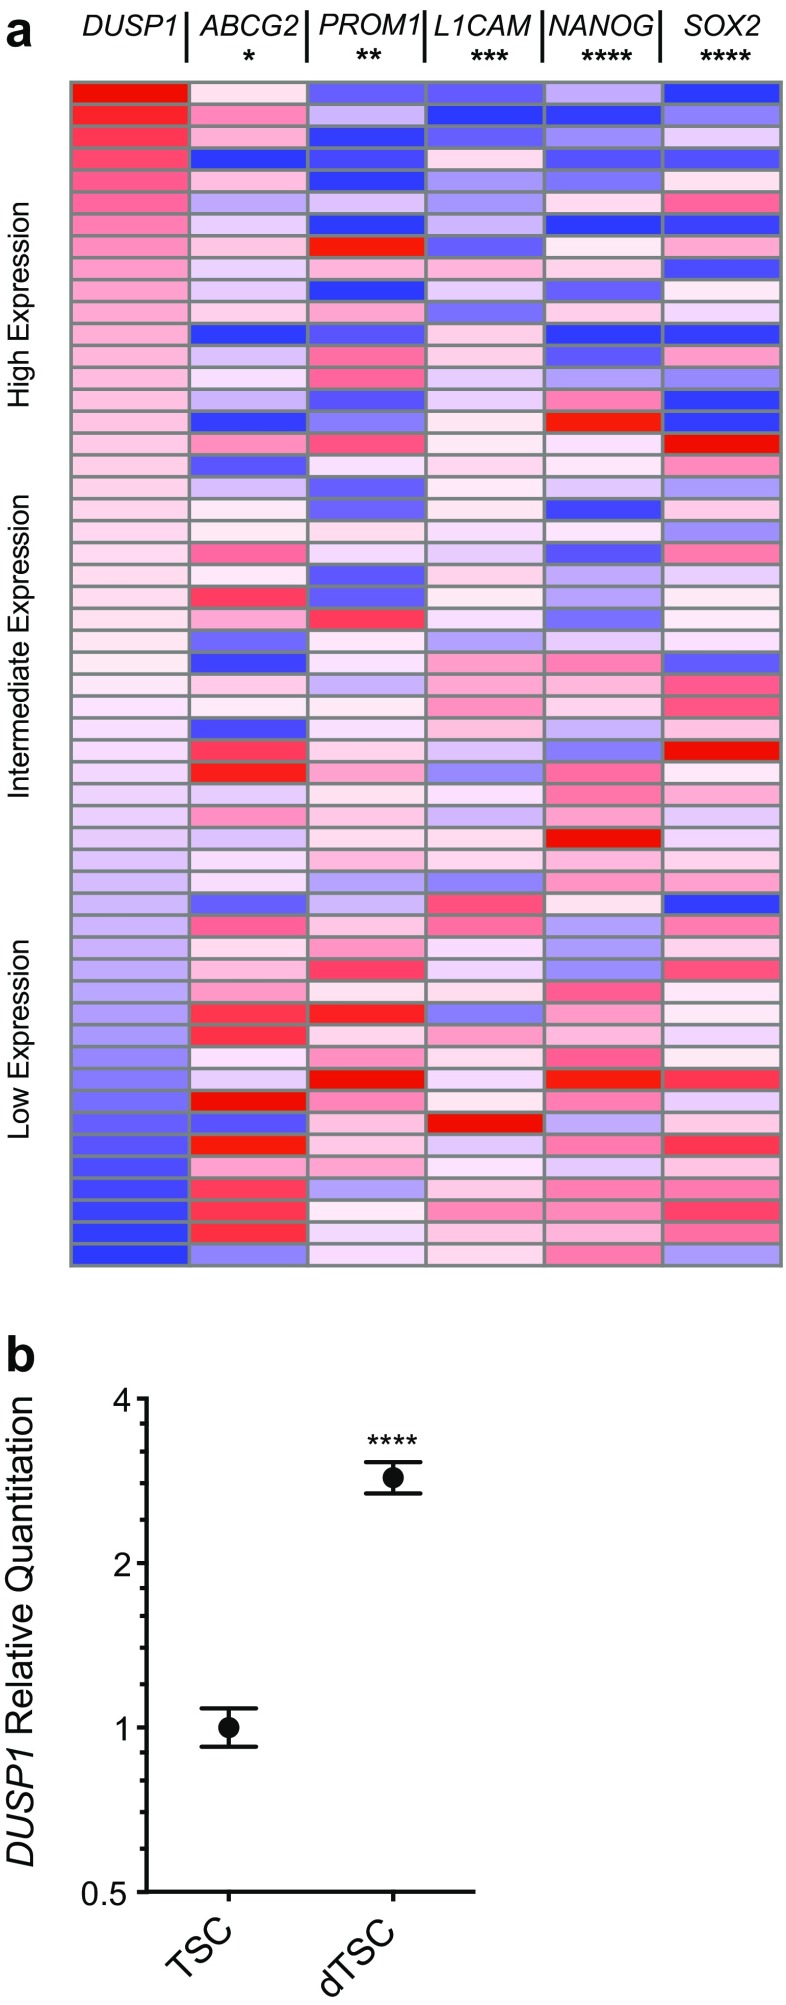
DUSP1 expression correlates with markers of GB TSC differentiation. a Expression heat maps for DUSP1 and the differentiation markers ABCG2, PROM1, L1CAM, NANOG, and SOX2 in GB samples from the TCGA microarray dataset (n = 547). Gene expression was normalized to the maximum expression values, sorted from max to min DUSP1 expression, and stratified into ten sample bins that are displayed as an average gene expression heatmap. Significance testing was performed using two-tailed, non-parametric Spearman correlation of DUSP1 with the known TSC markers (* = p < 0.05, ** = p < 0.01, *** = p < 0.001, **** = p < 0.0001). b qPCR analysis of DUSP1 expression in a patient-derived GB TSC line cultured for three days in vitro under conditions of serum-based differentiation. Fold induction of DUSP1 are plotted against the Log2 scale for differentiated (dTSC) group relative to undifferentiated stem cells (TSCs; n = 3 per group). Significance testing was performed using a t-test (**** = p < 0.0001)

