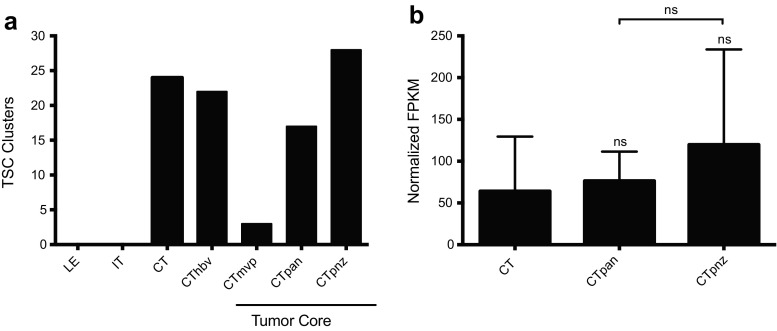
Fig. 8.
DUSP1 expression in perinecrotic regions within GB tumors. a) Quantification of TSC clusters identified and microdissected per GB subregion (LE = leading edge, IT = infiltrating tumor, CT = cellular tumor, CThbv = hyperplastic blood vessels, CTmvp = microvascular proliferation, CTpan = pseudopalisading cells around necrosis, CTpnz = perinecrotic zone) in Ivy GAP datasets. b DUSP1 RNA-seq data expressed as normalized fragments per kilobase of transcript per million mapped reads (FPKM) were obtained from the Ivy GAP consortium. TSC clusters identified in GB specimens were segmented into discrete tumor sub-regions including bulk cellular tumor (CT, n = 22), pseudopalisading cells around necrosis (CTpan, n = 16) and the perinecrotic zone (CTpnz, n = 26). Statistical analyses were performed using one-way ANOVA using Bonferroni to correct for multiple comparisons (ns = not significant)

