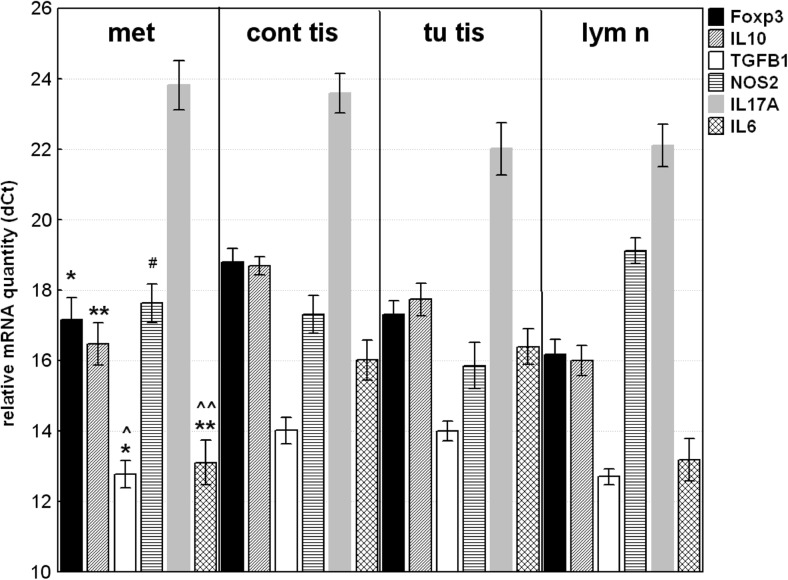
Fig. 4.
Relative mRNA quantity of Foxp3, IL10, TGFB1; IL6; NOS2 and IL17A genes in distant metastasis (met) compared to their non-tumoral mucosal counterparts (cont tis); to tumor tissue (tu tis) or to lymph node (lym n). The data are expressed as delta CT values normalized to geometric mean of two reference genes (GAPDH and 18srRNA); therefore a higher value represents a lower expression level. Statistical significance: * p < 0.05; ** p < 0.01 compared to compared to non-tumoral mucosal counterparts; ^^ p < 0.01; ^p < 0.05 - compared to tumoral tissue; # p < 0.05 - compared to regional lymph node

