Fig. 3.
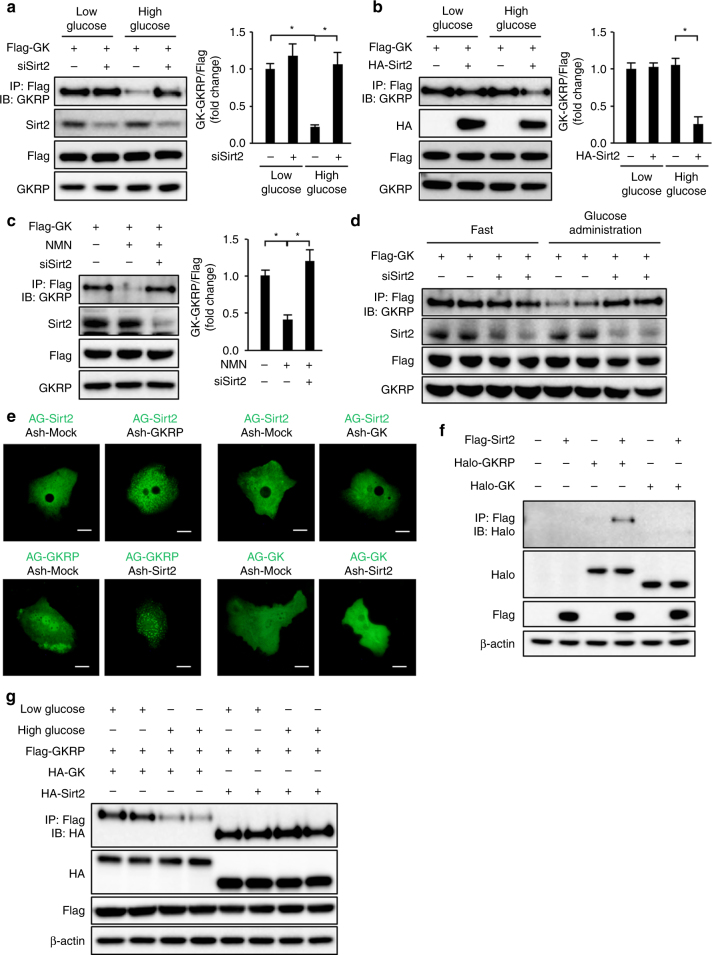
Sirt2 regulates glucokinase and GKRP dissociation. a–c Immunoblot analysis (IB) with the indicated antibodies of total cell lysate and precipitates after immunoprecipitation (IP) with anti-DYKDDDDK (Flag) tag antibodies from Sirt2-knockdown primary hepatocytes transfected with adenovirus vector encoding Flag-tagged glucokinase (Flag-GK) cultured in low- or high-glucose medium (a), from db/db mouse-derived hepatocytes transfected with adenovirus vectors encoding Flag-GK and HA-tagged Sirt2 (HA-Sirt2) cultured in low- or high-glucose medium (b), and from db/db mouse-derived primary hepatocytes transfected with adenovirus vectors encoding Flag-GK with and without Sirt2 knockdown cultured in high-glucose medium with and without NMN (c). GKRP levels coimmunoprecipitated with Flag-GK were normalized to Flag-GK expression and are shown in the right graph of each figure (n = 3 each). d Effect of Sirt2 knockdown on immunoprecipitation and immunoblot analysis of GK−GKRP binding in the liver from mice transfected with adenovirus vectors encoding Flag-GK 30 min after administration of glucose (4 g/kg) after 16-h fasting. e The interaction between Sirt2 and GKRP or glucokinase in primary hepatocytes detected by a fluorescent-based system for detecting protein−protein interactions using hAG-tagged Sirt2, hAG-tagged GKRP, hAG-tagged GK, Ash-Sirt2, Ash-GKRP, and Ash-GK. Scale bars indicate 20 μm. f Immunoprecipitation and immunoblot analysis of the interaction between Sirt2 and GKRP or Sirt2 and GK in HEK293 cells expressing Flag-tagged Sirt2, Halo-tagged GKRP, or Halo-tagged GK. g Immunoprecipitation and immunoblot analysis of GK−GKRP or Sirt2−GKRP binding in mouse primary hepatocytes transfected with adenovirus encoding Flag-GKRP and HA-GK or HA-Sirt2 in low- or high-glucose medium. Data are normalized to control (a−c). *P < 0.05; one-way ANOVA with the Fisher’s PLSD post-hoc test (a–c). All data are representative of at least three independent experiments. Error bars show s.e.m.

