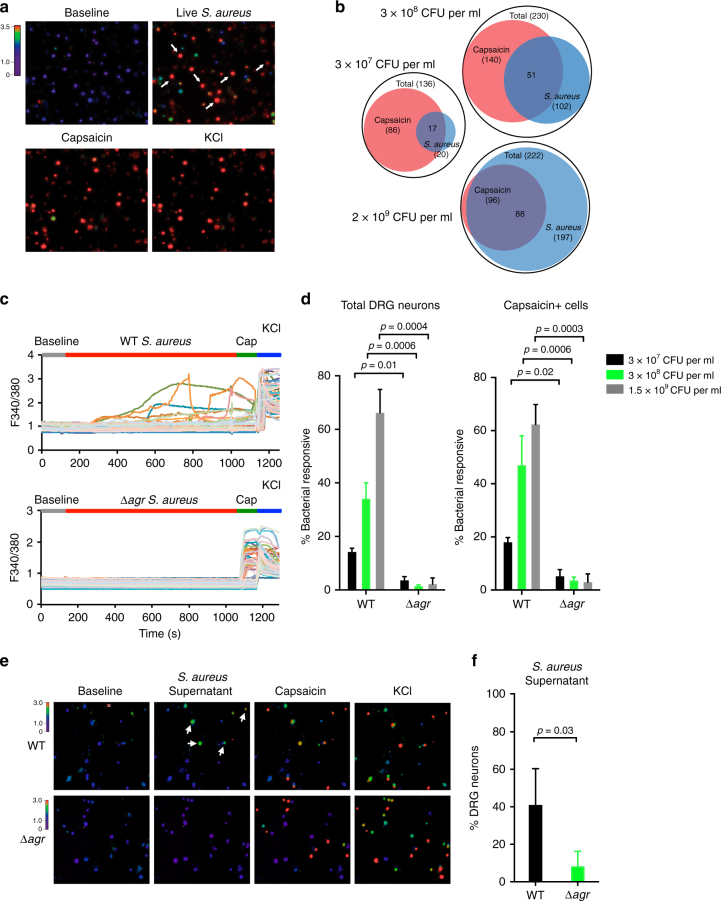
Fig. 2.
Live S. aureus directly induces DRG neuronal responses dependent on the agr virulence determinant. a Representative fields of Fura-2 calcium imaging of DRG sensory neurons exposed to live S. aureus (USA300, 2 × 10⁹ CFU per ml), followed by capsaicin (1 μM) to activate nociceptors, and KCl (40 mM) to depolarize all sensory neurons. Arrows indicate neurons responding to bacteria. b Venn diagrams showing subsets of DRG neurons responding to different doses of live S. aureus or to the TRPV1 ligand, capsaicin. c Neuronal calcium traces from representative fields of neurons exposed to WT or Δagr S. aureus (1.5 × 10⁹ CFU per ml), followed by capsaicin (1 μM), and KCl (40 mM). d Quantification of the proportion of total DRG neurons (left) or capsaicin + neurons (right) responding to WT or Δagr S. aureus at three different bacterial doses: 3 × 10⁷ CFU per ml: n = 3 fields each; 3 × 10⁸ CFU per ml: n = 5 fields each; 1.5 × 10⁹ CFU per ml: n = 4 fields each. p values, unpaired t test. e Representative imaging fields (arrows indicate neurons responding to bacterial supernatant) and f quantification of the proportion of neurons responding to culture supernatant from WT or Δagr S. aureus. n = 4 fields (WT), n = 3 fields (Δagr). a–d, N = 3 replicates; f, N = 2 replicates. p values, unpaired t test; error bars throughout figure, mean ± s.e.m.

