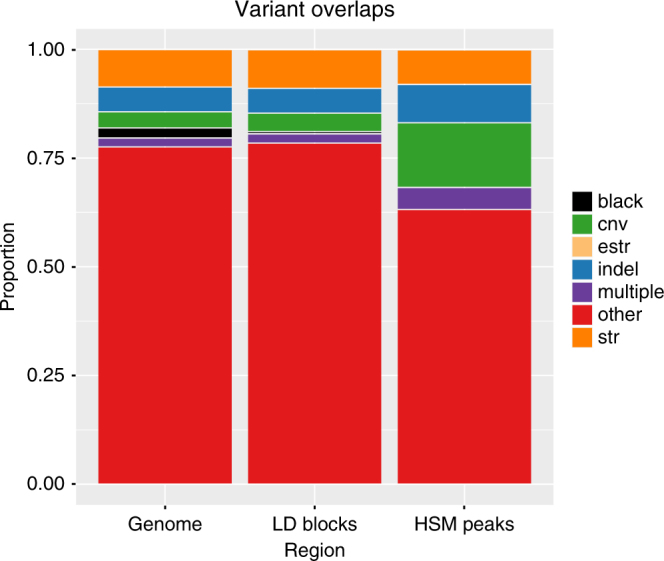
Fig. 2.

HSM peak overlap with genetic variants. Overlap of HSM peak significant windows with genetic variants in the Genome, GWAS LD block regions and the HSM peaks. Black=blacklist regions from ENCODE (removed from subsequent analysis); CNV (Green)=copy number variants from the database of genomic variants from Zarrei et al.68; STR (Orange)=short tandem repeats from Willems et al.69; eSTR (Fawn)=expression-associated short tandem repeats from Gymrek et al.70; Indel (Blue) from TwinsUK data set; multiple variant overlaps (Purple) and other category (Red) will comprise common SNPs which include CpG-SNPs
