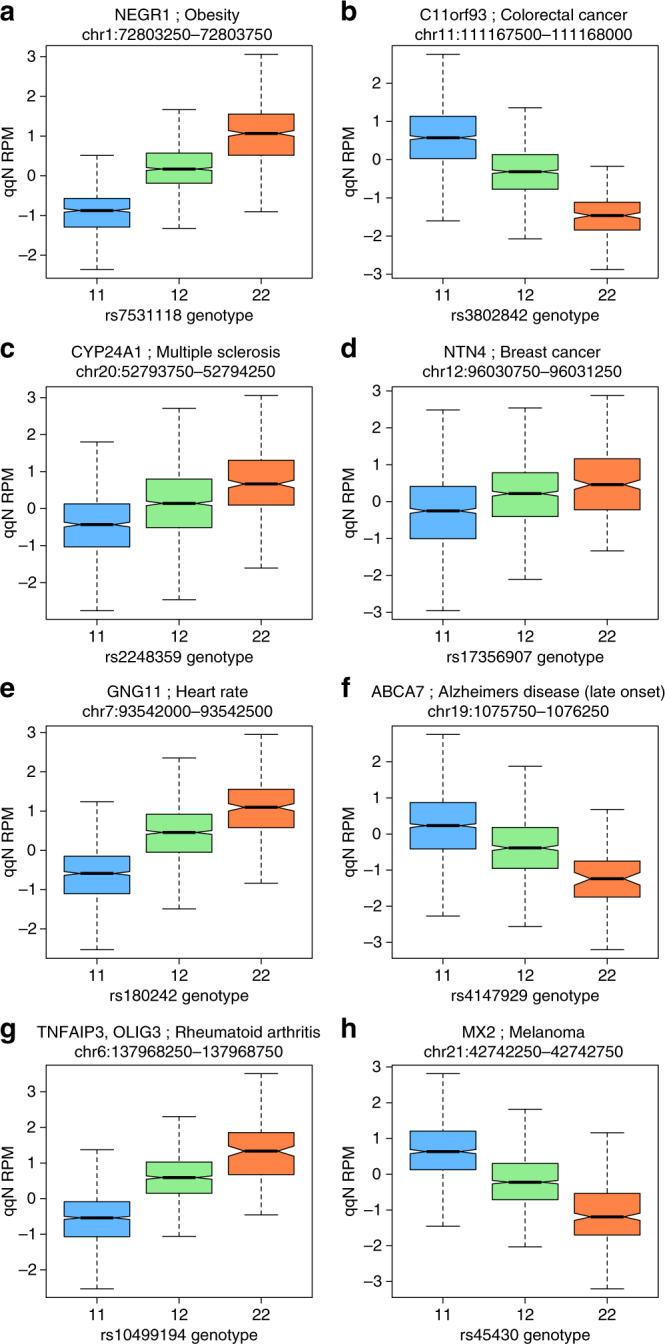
Fig. 4.

Variation by genotype within selected HSM peaks. Boxplots of most significant 500 bp windows within HSM peaks from within selected the GWAS LD block regions from Fig. 3. Normalised reads per million DNA methylation (y-axis: qqN RPM) within window by genotype for the GWAS SNP (x-axis: Genotype categories represented as 11, 12 and 22). a NEGR1 obesity locus, rs7531118; b intergenic colorectal cancer, rs3802842; c CYP24A1 multiple sclerosis, rs2248359; d NTN4 breast cancer, rs17356907; e GNG11 Heart Rate, rs180242; f ABCA7 Alzheimer’s disease, rs4147929; g TNFAIP3 rheumatoid arthritis, rs10499194 and h MX2 Melanoma, rs45430
