Fig. 2.
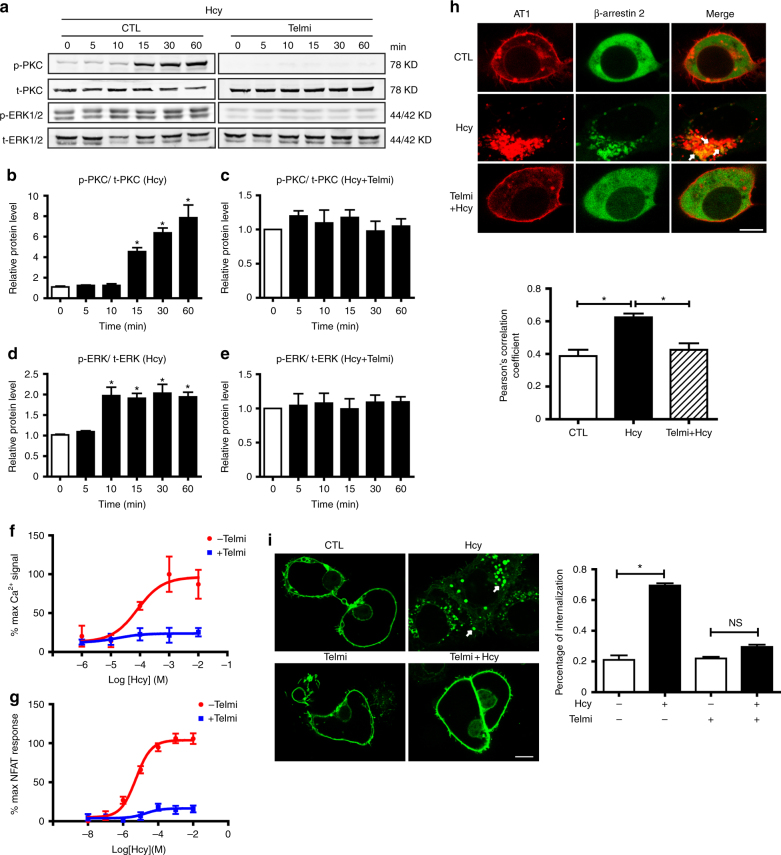
Hcy activates the AT1 receptor downstream Gq and β-arrestin 2 signaling pathways. a–e Representative western blots and quantification of phosphorylated and total PKC and ERK1/2 in Hcy (100 μM)-treated HEK293A cells (transfected with the human AT1 receptor) with or without telmisartan (1 μM) pretreatment. The data represent as mean ± SEM, N = 6. *P < 0.05, one-way ANOVA followed by the Bonferroni post hoc test. f Ca2+ signaling in HEK293A cells (transfected with the human AT1 receptor) stimulated by Hcy with or without telmisartan (1 μM) pretreatment, detected using Fluo 3-AM and quantified by the Leica confocal microscope system. The data represent as mean ± SEM, N = 6. g Hcy-induced NFAT signaling with or without telmisartan (1 μM) pretreatment, detected by the dual-luciferase assay system (Promega). The data represent as mean ± SEM, N = 6. h Representative fluorescence and quantification of Hcy (100 μM)-induced co-localization of the AT1 receptor (overexpression of human AT1-mCherry plasmid; red) and β-arrestin 2 (overexpression of β-arrestin 2-GFP plasmid; green) in cultured HEK293A cells. The merged area is indicated as yellow (arrows). Scale bar, 10 μm. The data represent as mean ± SEM, N = 6, *P < 0.05, one-way ANOVA followed by the Bonferroni post hoc test. i Representative fluorescence and quantification of Hcy (100 μM)-induced AT1 receptor (overexpression of mouse AT1a-GFP plasmid; green) internalization (arrows) with or without telmisartan pretreatment in COS7 cells. The data represent as mean ± SEM, N = 10, *P < 0.05, two-way ANOVA followed by the Bonferroni post hoc test

