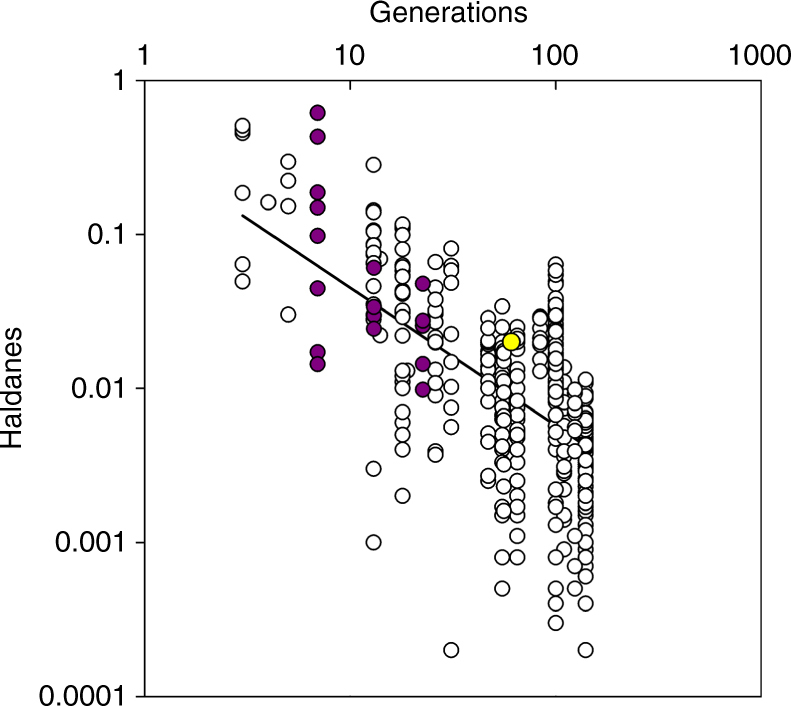
Fig. 2.

Rates of evolution are slower when measured over longer time intervals. Rates, plotted in haldanes (standard deviations of change per generation), are shown for metabolic rate in guppies from the El Cedro River from this study (yellow, n = 1), previously published estimates for guppy life history traits from the El Cedro River (purple, n = 18)30, and previously published estimates for life history and morphological traits of other taxa (white, n = 402)30. All estimates are absolute values of haldanes derived from common garden or quantitative-genetic methods. Note the logarithmic scale on both axes
