Fig. 3.

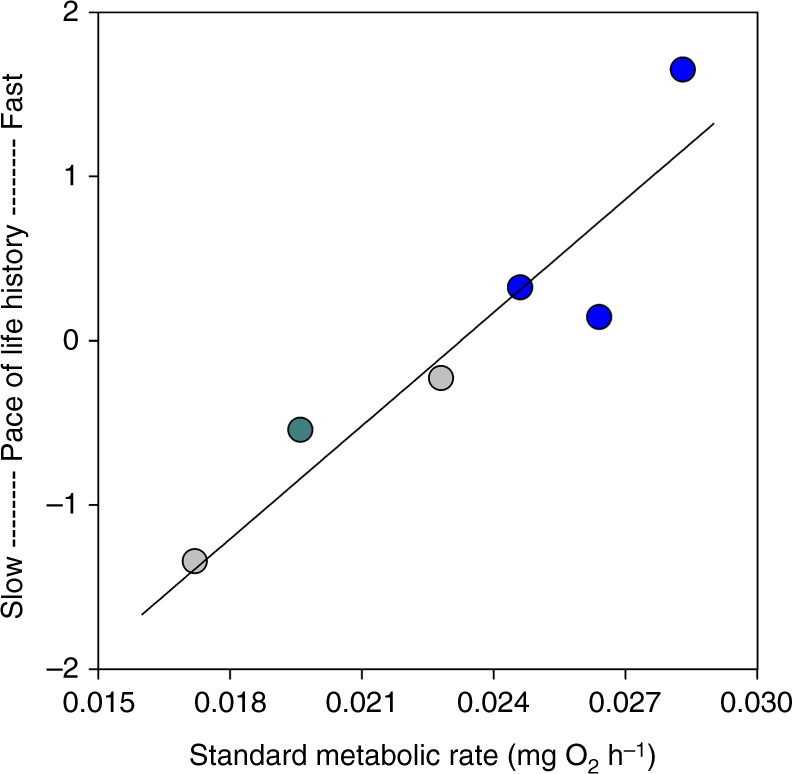
Standard metabolic rate covaries with the pace of life history. Standard metabolic rate was positively correlated with a suite of life history traits across six populations (Pearson correlation: P = 0.007). Included are naturally occurring populations with fast-paced (blue, n = 3) and slow-paced life histories (gray, n = 2) and a population transplanted from a high- to low-predation site 35 years ago that has since evolved a slow-paced life history (green, n = 1). The pace of life history was determined using principal component analysis (PCA) of estimates for the suite of traits including male age and mass at maturity, female age and mass at first parturition, inter-litter interval, and reproductive allotment. The first principle component (plotted on the y axis) had an eigenvalue of 3.70, explained 61% of the variation in life history traits, and differentiated populations with later maturity and lower reproductive investment (lower scores) from those with earlier maturity and higher reproductive investment (higher scores). Values for standard metabolic rate were standardized to a common body mass of 74 mg prior to analysis (mean across all fish)
